
Inspired by the results of analyzing the biological ages of renowned anti-aging advocates through their photos, particularly the remarkable results of David Sinclair, I decided to conduct a more detailed analysis of his images over different years. Here are the findings.
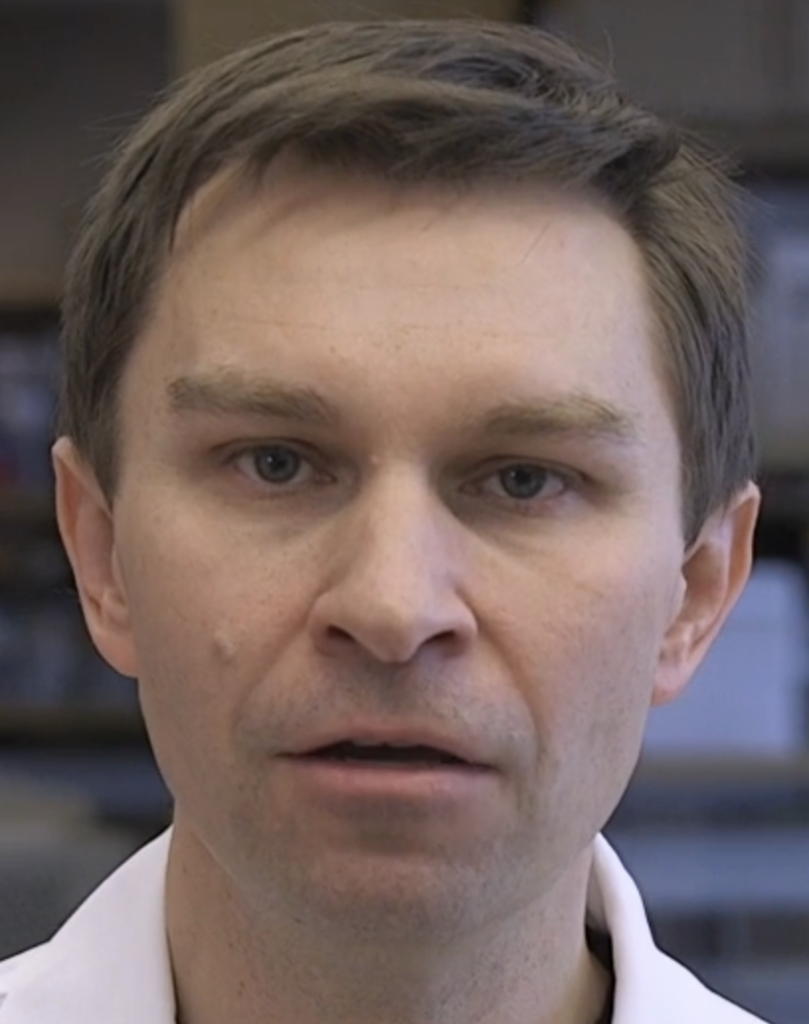
2015


Source videos:
https://www.youtube.com/watch?v=2Yug9LzGkxs
https://www.youtube.com/watch?v=AiCvqnUIe04
https://www.youtube.com/watch?v=lA4DbN01q70
I only found two videos from 2015, so I included one from 2016.
Detected ages: (43 + 39 + 42)/3 = 41.3 years.
Actual age: 45.5 years.
Difference: 41.3 – 45.5 = -4.2 years.
2017


Source videos:
https://vimeo.com/208689854
https://www.youtube.com/watch?v=7DD31aBTE44
https://vimeo.com/261202564
Again, I had to include one video from 2018 as I couldn’t find three from 2017.
Detected ages: (45 + 42 + 42)/3 = 43.0 years.
Actual age: 47.5 years.
Difference: 43.0 – 47.5 = -4.5 years.
2019


Source videos:
https://www.youtube.com/watch?v=9nXop2lLDa4
https://www.youtube.com/watch?v=Eu0GksWf5pI
https://www.youtube.com/watch?v=IEz1P4i1P7s
Detected ages: (36 + 36 + 39)/3 = 37.0 years.
Actual age: 49.5 years.
Difference: 37.0 – 49.5 = -12.5 years.
2021


Source videos:
https://www.youtube.com/watch?v=GSkkBkMcwdY
https://www.youtube.com/watch?v=EKa9eEotA54
https://www.youtube.com/watch?v=BRFqPSy48b4
Detected ages: (32 + 32 + 39)/3 = 34.3 years.
Actual age: 51.5 years.
Difference: 34.3 – 51.5 = -17.2 years.
Despite the good results, I can’t help but wonder if the ‘crisis-quality’ videos from our rather theatrically-handled “COVID-era” may have affected age detection due to the blurred screenshots. Blurred images can smooth out wrinkles! 🙂
2023


Source videos:
https://www.youtube.com/watch?v=_yCGV-Z3vhg
https://www.youtube.com/watch?v=fsUUgTPtwnc
https://www.youtube.com/watch?v=y6xk_qDwZ4A
Detected ages: (35 + 39 + 40)/3 = 38.0 years.
Actual age: 53.5 years.
Difference: 38.0 – 53.5 = -15.5 years.
If we attribute the excellent results of 2021 to the blurred images, we could potentially “flatten the curve” (jokingly) and postulate that David’s anti-aging process is on the right track. It could be argued that he has managed to halt his apparent aging since 2017.
For more accurate averaging, I’ll also incorporate previous data I’ve collected on David. This leads to the following table (I’ve omitted the calculations for brevity):
| Year | 2015 | 2017 | 2019 | 2021 | 2022 | 2023 |
| Years gained | 4.2 | 4.5 | 11.8 | 17.2 | 14.0 | 15.2 |

It’s interesting that David himself says that according to his DNA test, he is 10 years younger than his chronological age. – Even more, David!
My next task is to analyze the information shared by David during the period of 2017-2019, to try to understand what significant changes he made in his life to achieve such extraordinary results. If you have any ideas, please share them in the comments.
Disclaimer
The information provided in this article is for general informational purposes only. The content presented on this website should be considered solely as opinions and personal experiences. Read more
Evidence note: This article may combine established physiology, published research, clinical experience, personal interpretation, and speculative hypotheses. It is for educational purposes only and is not medical advice.