We started with a simple question: is thirst enough, or should healthy people deliberately drink more water? Following the evidence led us through kidney stones, vasopressin, marathon runners, industry-funded hydration research, animal experiments, and two exploratory analyses of US population data. The answer turned out to depend less on litres than we expected.
The short answer
For a healthy adult living under ordinary conditions, there is no well-established universal target for plain water such as 2, 2.5 or 3 litres per day.
Official recommendations usually refer to total water intake, including water from food and all beverages. Water requirements also vary considerably with body size, diet, temperature, exercise, pregnancy, illness and sweat loss.
Thirst, ordinary drinking habits and meals appear to provide a reasonable starting point for most healthy adults. There are situations where deliberately increasing fluid intake is useful, especially for people prone to kidney stones and probably for some women with recurrent cystitis who normally drink very little.
What remains uncertain is a more interesting question: can a healthy person who is maintaining normal water balance still benefit from drinking more because this reduces the work the body has to do to conserve water?
That question is much less settled.
We first looked for the correct number of litres
The American reference values of about 3.7 litres per day for men and 2.7 litres for women are often repeated as if they were drinking-water prescriptions.
They are not.
They refer to total water, including water contained in food and beverages. Coffee counts. Tea counts. Milk, fruit, vegetables and soup contain water as well.
The European Food Safety Authority gives somewhat lower population reference values, around 2.5 litres of total water for men and 2.0 litres for women under ordinary conditions.
| Reference | Men | Women | What the number includes |
|---|---|---|---|
| US National Academies | 3.7 L/day | 2.7 L/day | Total water from drinks and food |
| EFSA | 2.5 L/day | 2.0 L/day | Total water from drinks and food |
Neither set of numbers came from a long-term experiment showing that people assigned to these exact quantities became healthier or lived longer. They are reference values for populations, not experimentally discovered optimal doses for each individual.
A large isotope study published in Science in 2022 made the problem with fixed targets very clear. Yamada and colleagues measured water turnover in 5,604 people from 26 countries, ranging in age from eight days to 96 years. Water turnover varied with age, body size and composition, physical activity, pregnancy, athletic status, temperature, humidity, altitude and socioeconomic conditions.
A small person doing office work in a cool climate and a large person doing manual work in tropical heat do not have the same water requirement. Once this is taken seriously, a universal number of litres becomes difficult to defend.
But this still left another possibility. Perhaps the correct amount differs between people, while many people still drink less than is physiologically ideal.
To examine that, we had to separate water intake from hydration.
Drinking two litres does not tell us whether someone is well hydrated
Suppose two people drink exactly two litres during a day.
One spends the day at a desk. The other works outside in heat and loses several litres through sweat.
Their intake is identical, but their water balance is not.
The body continuously adjusts for this difference. When relatively less water is available, the kidneys conserve more of it. A hormone called arginine vasopressin, or AVP, is important in this process. Higher AVP makes the kidneys return more water to the body, so urine volume decreases and urine becomes more concentrated.
Researchers often measure copeptin instead of AVP because it is more stable in blood and is released together with vasopressin.
A person can therefore drink relatively little while keeping blood sodium and plasma osmolality within a normal range. The kidneys compensate by conserving water. Another person can drink considerably more, produce much more dilute urine, and still have similar blood chemistry.
For this reason, concentrated urine is not by itself evidence of dangerous dehydration. Often it shows that the water-conservation system is active.
At this point our original question changed.
Could successful compensation still have a long-term cost?
Imagine a healthy person who habitually drinks relatively little.
Blood sodium remains normal. There are no obvious symptoms. The kidneys produce less and more concentrated urine, while vasopressin activity remains somewhat higher.
Is this completely harmless over several decades?
Controlled studies show that increasing water intake in habitual low drinkers can increase urine volume, reduce urine osmolality and lower copeptin. Observational studies have also linked higher copeptin with diabetes, chronic kidney disease and several other adverse outcomes.
A possible mechanism exists: chronic low water availability could maintain higher vasopressin activity, and this physiological state might eventually influence health.
There are also several reasons for caution. Copeptin is influenced by more than water intake. Kidney function and metabolic disease can alter it. Disease may also alter the hydration markers that are later associated with disease.
One distinction matters here: concentrated urine can reflect normal AVP-mediated water conservation, not necessarily a harmful state. AVP is regulated by both osmotic and non-osmotic signals. During prolonged exercise, drinking excessive hypotonic fluid relative to losses and excretion, together with persistent non-osmotic AVP secretion, can contribute to exercise-associated hyponatremia (Hew-Butler et al., 2015). This shows why the hormone response and drinking behaviour should not be conflated. Whether modest, sustained elevations of AVP or its marker copeptin independently cause long-term harm remains an open question; a spot urine-osmolality threshold cannot establish that causal link.
Randomized trials are therefore particularly useful.
There are surprisingly few of them.
Only 18 randomized trials survived a systematic review
A 2024 systematic review in JAMA Network Open screened 1,464 records dealing with changes in daily water intake.
Only 18 randomized clinical trials met the inclusion criteria.
The trials were heterogeneous and often small. They studied kidney stones, urinary infections, weight loss, migraine, glucose control, hypotension and several other outcomes. The overall evidence base remained limited.
A useful pattern nevertheless appeared. The clearest clinical results came from conditions where additional water had a direct physical mechanism.
Kidney stones are the best example.
| Study | Population | Water intervention | Main result |
|---|---|---|---|
| Borghi, 1996 | 199 people after a first calcium stone | Increased water intake | Recurrence: 12/99 vs 27/100 |
| Hooton, 2018 | 140 low-drinking women with recurrent cystitis | +1.5 L/day | 1.7 vs 3.2 cystitis episodes/year |
| CKD WIT, 2018 | 631 adults with stage 3 CKD | Increased water intake | Copeptin fell; adjusted eGFR difference -0.3, not significant |
| PUSH, 2026 | 1,658 people with urinary stone disease | Intensive hydration-adherence programme | Symptomatic events: 19% vs 20%; HR 0.96 |
Kidney stones: the strongest simple case for drinking more
Many kidney stones form when stone-producing substances become sufficiently concentrated in urine.
Increasing urine volume dilutes them.
In a classic five-year randomized trial by Borghi and colleagues, 199 people who had experienced a first calcium stone were assigned either to increased water intake or to usual behaviour.
Stone recurrence occurred in 12 of 99 people in the increased-water group and 27 of 100 controls.
The mechanism is easy to understand and the difference was substantial.
A much larger trial has now added an important qualification. The PUSH trial was published in The Lancet in March 2026 and included 1,658 people with urinary stone disease and low 24-hour urine volume.
Participants in the intervention group received a multicomponent programme designed to increase fluid intake, including a fluid prescription, coaching, financial incentives and other adherence tools. The control group received guideline-concordant care.
After a median follow-up of 738 days, symptomatic stone events occurred in 154 of 826 participants (19%) in the intervention group and 165 of 832 (20%) in the control group. The hazard ratio was 0.96 (95% CI 0.77–1.20). Urine volume increased in both groups and remained modestly higher in the intervention group.
So an intensive programme to increase fluid intake did not reduce symptomatic recurrence beyond guideline-based care in this trial.
This does not make urine volume irrelevant. The physiological separation between the two groups was considerably smaller than one might assume from the labels “intervention” and “control”. Both groups were already being managed within a stone-prevention setting.
For stone prevention, the clinically useful variable may therefore be urine volume, rather than the number of litres written in a drinking target. PUSH tested whether additional behavioural support improved outcomes beyond usual stone-prevention care, not whether increasing urine volume can prevent stones. Urine volume matters, but so does urine chemistry: for some patients, increasing fluid intake may be insufficient or difficult to sustain, making other preventive strategies important.
Recurrent cystitis gave a strong result in a very specific population
A randomized trial published in 2018 studied 140 premenopausal women with recurrent cystitis who normally drank less than 1.5 litres of fluid per day.
Half were asked to add 1.5 litres of water daily for one year.
The water group had substantially fewer recurrent cystitis episodes. Their urine volume also increased markedly.
There is a plausible mechanism. More urine and more frequent urination may reduce the time bacteria remain in the urinary tract.
We looked more closely because the study was funded by Danone Nutricia Research, several authors worked for Danone Research, and the water was supplied by Evian.
The original protocol showed that low drinkers were already the intended population before recruitment. The study had not started with a general population and later been reframed around low drinkers after seeing the results.
There was, however, a later change to the inclusion criteria. Recruitment was paused and a urine-osmolality requirement of at least 500 mOsm/kg was added. The statistical plan contained a comparison between participants recruited before and after this change. We did not find that comparison in the published paper or public results.
The available material does not establish why it was omitted.
For our main question, the important point is the population. This was a trial in women who already drank unusually little. It supports increased water intake in that group. It tells us much less about whether a healthy person with ordinary drinking habits should add another litre.
A kidney trial changed how we looked at hydration biomarkers
The CKD WIT trial included 631 adults with stage 3 chronic kidney disease.
Participants were randomized either to coaching aimed at increasing water intake or to maintaining their usual intake.
The intervention clearly changed water physiology. Twenty-four-hour urine volume increased by about 0.6 litres per day more in the hydration group, and plasma copeptin fell by 2.2 pmol/L relative to controls.
Kidney function did not improve.
The mean one-year decline in estimated glomerular filtration rate, or eGFR, was 2.2 mL/min/1.73 m² in the hydration group and 1.9 in controls. The adjusted difference was only -0.3.
This distinction became important in the rest of our investigation.
Additional water can make urine more dilute, increase its volume and reduce copeptin. These are genuine physiological effects. They do not tell us by themselves whether disease risk has changed.
Why 500 mOsm/kg became an important number
Urine osmolality describes how concentrated urine is.
Higher values mean more dissolved material relative to water.
In 2015, Perrier and colleagues proposed approximately 500 mOsm/kg in 24-hour urine as a practical indicator of “optimal hydration”. Several calculations in the paper produced values in roughly this range. The study included 95 adults, and several authors were affiliated with Danone Research.
The number later became part of a broader “hydration for health” model.
A subsequent review proposed total water intake of roughly 2.5 to 3.5 litres per day, sufficient to produce around 2 to 3 litres of urine below 500 mOsm/kg. The proposed goal was not simply to avoid clinical dehydration. It was also to reduce vasopressin activity and the physiological effort involved in conserving water.
We wanted to know whether 500 looked like a real biological boundary in health data.
This led to our first analysis of the National Health and Nutrition Examination Survey (NHANES), a large US programme run by the Centers for Disease Control and Prevention (CDC) and its National Center for Health Statistics.
Our first NHANES analysis: does anything special happen at 500?
We performed an exploratory participant-level analysis of NHANES 2011–2012.
The main analysis included adults aged 51 to 70. We linked spot urine osmolality to kidney measurements and available mortality follow-up using the participant identifier.
This was not a peer-reviewed study. The mortality analysis contained 1,655 people and 66 deaths. Our main calculations did not use the complete NHANES survey design with weights, strata and primary sampling units. Urine osmolality was measured once, and the kidney analysis was cross-sectional.
The question was narrow: does 500 mOsm/kg appear to be a special risk boundary?
It did not.
Among participants with urine osmolality below 500, crude mortality was 4.76%. It was 3.93% at 500–799 and 2.82% at 800 or above.
Those crude percentages should not be interpreted as evidence that concentrated urine is protective. Many factors can alter this relationship.
After adjustment for age and sex, urine osmolality of 500 mOsm/kg or higher was still not associated with higher mortality. The hazard ratio was 0.71, with a 95% confidence interval of 0.43–1.16.
For our combined kidney outcome, the age- and sex-adjusted odds ratio was 0.87 (0.67–1.13).
We also repeated the mortality analysis using thresholds from 300 to 900 mOsm/kg, instead of choosing 500 in advance.
No obvious change in risk appeared around 500.
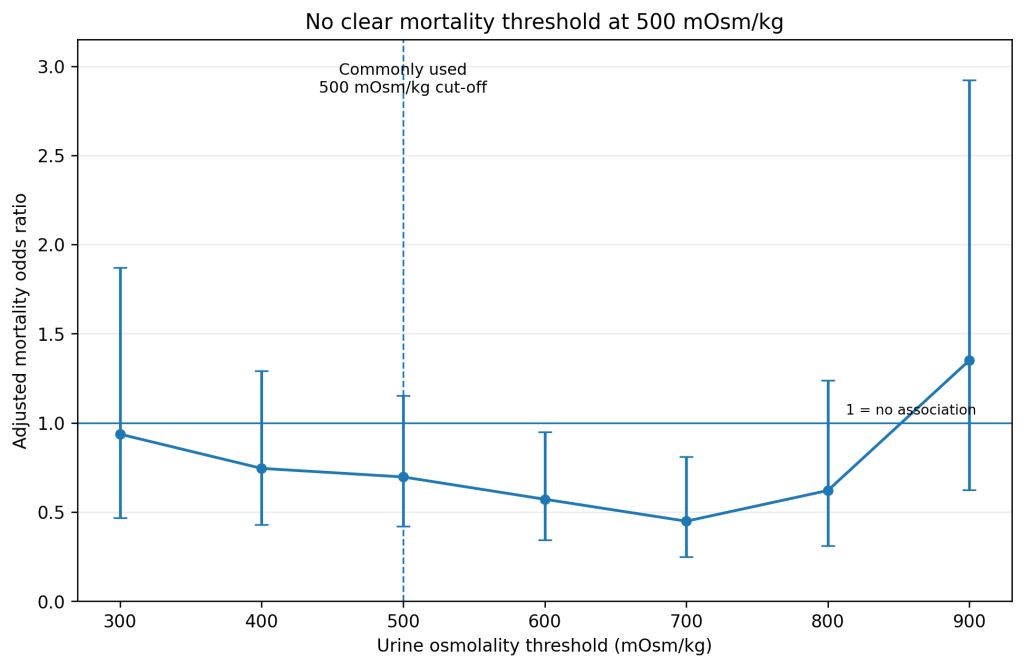
The result supports a limited conclusion: in this dataset, 500 mOsm/kg did not behave like a clearly demonstrated boundary between harmless and harmful hydration.
There was another problem with urine concentration as a direct hydration score.
Kidney function itself changes urine concentration
Producing concentrated urine requires functioning kidneys.
As kidney disease progresses, concentrating capacity can deteriorate.
Relatively dilute urine may therefore occur because a person drinks a lot, but also because the kidneys are less able to conserve water.
The Centers for Disease Control and Prevention (CDC) documentation for NHANES notes that urine osmolality may reflect hydration status or impaired renal function.
An independent analysis of NHANES 2009–2012 included 7,373 participants and used survey-weighted models with more extensive adjustment.
The highest urine-osmolality quartile initially appeared to have fewer adverse kidney outcomes, but the association was no longer statistically significant after full adjustment. The relationship also differed according to kidney function.
This makes urine osmolality useful physiologically, but difficult to interpret as a universal health score.
At this stage another basic problem became important.
Many studies define people as “low water consumers” using one day of reported intake.
How stable is that classification?
Our second NHANES analysis: does a habitual low-water consumer really exist?
NHANES 2011–2012 collected two detailed 24-hour dietary recalls from many of the same participants.
The first was conducted in person. The second was performed by telephone 3–10 days later.
For our second exploratory analysis, we selected adults aged 20 or older with two reliable dietary recalls, an appropriate two-day dietary weight and an available urine-osmolality measurement.
The final sample contained 4,134 adults.
Our primary intake variable was not plain drinking water. We used total moisture from food, beverages and water.
This matters because somebody who drinks little plain water may still receive substantial water from coffee, tea, fruit, vegetables, milk or other foods and drinks.
Water intake showed a moderate relationship between the two days. The survey-weighted Pearson correlation was 0.478. The unweighted Spearman correlation was 0.527.
The movement between intake groups was more informative.
Among participants in the lowest quarter of total water intake on Day 1, 50.7% were again in the lowest quarter on Day 2.
If intake rank on the two days had been unrelated, we would expect about 25%.
At the high end, 53.3% of people in the highest quarter remained there on Day 2.
This suggests that relative water intake contains a real person-level pattern.
It is not highly stable, however. Almost half of the people classified as low intake on one day were no longer in the lowest quarter several days later.
That has consequences for observational research based on one 24-hour recall.
We then compared urine concentration between the two-day intake patterns.
Participants who remained in the lowest water-intake quarter on both days had a median urine osmolality of 697 mOsm/kg.
Those who were low only on Day 1 had a median of 655.
Those who were low only on Day 2 had a median of 644.
Participants who were never in the lowest quarter had a median of 619 mOsm/kg.
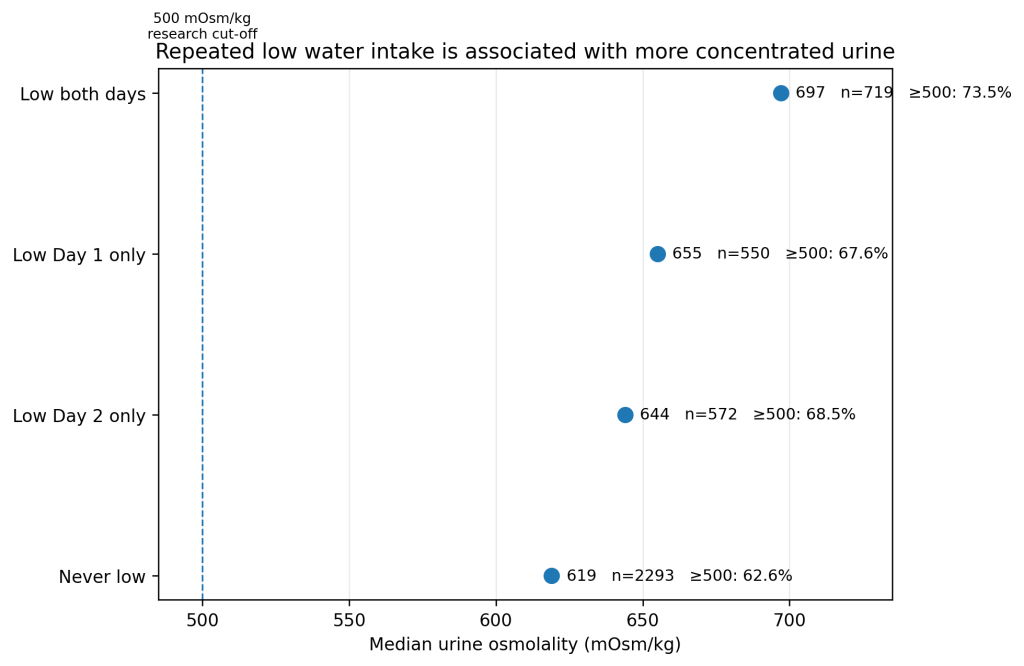
The distributions overlap substantially. Still, the stable-low group had more concentrated urine than the never-low group.
We tested the pattern in other ways.
When low intake was defined separately within men and women, the stable-low group had a median urine osmolality of 701 mOsm/kg, compared with 613 in the never-low group.
Using a simple threshold of approximately 2 litres of total moisture per day gave a similar result: 695 mOsm/kg among people below this level on both days and 617 among those above it on both days.
These analyses do not show that habitual low intake causes disease.
They answer an earlier methodological question: a relatively stable low-water phenotype does appear to exist, but repeated measurements identify it much better than a single day of intake.
That is important because it suggests how the main hydration hypothesis should eventually be tested.
The funding question
As we followed the literature around “optimal hydration”, copeptin and the 500 mOsm/kg target, Danone appeared repeatedly.
Water is a major part of Danone’s business. In its 2025 reporting, Waters represented about 18% of group sales, and the company described itself as the world’s number-two producer of packaged waters.
Several influential hydration papers have authors affiliated with Danone Research, including the study proposing the approximately 500 mOsm/kg target. The recurrent-cystitis trial also involved Danone Research employees.
This does not make the studies invalid.
The more relevant question is whether commercial funding can influence which scientific questions receive continued attention.
A water company does not need to show that one brand is healthier than tap water to benefit from a general shift towards deliberate, higher water intake.
The trials we reviewed did not support a simple theory of manufactured positive findings. Some industry-linked studies were positive, others were not.
The potential influence is more likely to operate at the level of research priorities and framing: repeated investigation of whether people drink too little, whether their urine should be more dilute and whether vasopressin should be lower.
The broader question has received less direct testing: do otherwise healthy people live longer or develop less disease if they deliberately drink more than their normal behaviour would lead them to drink?
Human longevity data are less dramatic than hydration biomarkers
A 2021 meta-analysis combined seven prospective cohorts with approximately 116,800 participants and 14,754 deaths.
Neither drinking-water intake nor total water intake showed a convincing overall association with all-cause mortality in the main comparisons. Higher total water intake was associated with lower cardiovascular mortality, while some dose-response analyses produced additional signals.
These are observational studies, and water intake is difficult to measure over long periods.
Our own two-day NHANES analysis shows part of the problem. A person can move considerably in the intake distribution within a few days.
A single dietary survey can describe yesterday reasonably well and still be a poor description of someone’s usual intake across many years.
Animal experiments allow tighter control.
The mouse result was interesting, but the experiment was small
A 2019 NIH study kept mice under mild lifelong water restriction starting at one month of age.
The water-restricted mice developed more concentrated urine and several metabolic, inflammatory and degenerative changes. Their lifespan was reported to be about six months, or 18%, shorter than that of controls.
The survival comparison, however, contained only 11 control mice and 6 water-restricted mice.
This is useful causal evidence, but 18% should not be treated as a precise, established estimate of the effect of chronic mild water restriction.
We did not find a large independent lifelong replication.
Experiments in fruit flies provided another perspective.
Fruit flies suggest that water requirement depends on the rest of the diet
In experiments on Drosophila, providing extra water did little to lifespan under an ordinary diet.
The picture changed when the diet contained much more sugar.
A 2020 study found that high dietary sugar created a water-balance problem and shortened lifespan. Giving the flies access to additional water removed much of this excess mortality even though obesity, high glucose and insulin resistance remained.
In the experiments reviewed during our investigation, higher sugar concentrations produced progressively larger reductions in lifespan when additional water was not available. Extra water removed much of the water-related mortality.
Related experiments found interactions with salt and with richer diets.
The useful point here is not that fly drinking behaviour can be directly translated into human recommendations.
It is that water requirement cannot be considered separately from what the kidneys need to excrete.
Salt and protein change the water equation
The kidneys must remove sodium, potassium, urea and other dissolved substances.
Suppose the kidneys need to excrete 1,000 units of dissolved material during a day.
If urine volume is 1.2 litres, average urine concentration will be about 833 units per litre.
If the same material is excreted in 2.5 litres, concentration falls to about 400.
There is also another possibility: reduce the amount of solute that must be excreted.
This is why diet matters.
Salt contributes to the renal solute load. Protein contributes largely through urea. Sweat loss, physical activity and temperature change the water side of the equation.
Two people drinking the same two litres can therefore place quite different demands on their water-regulation systems.
This became especially clear in studies of heavy work in heat.
Five litres can still be insufficient during heavy work in heat
Some agricultural workers in Central America report drinking five or six litres during a workday and still show signs of acute kidney stress.
Their water losses and physical exposure are extreme.
Heavy work in heat increases sweat loss, raises body temperature, changes kidney blood flow and adds metabolic and inflammatory stress.
In such populations, the workers who drink more may also be those doing the hardest work and losing the most water.
This can even produce an observational association in which higher reported water intake accompanies worse kidney outcomes.
Intervention programmes combining water, electrolytes, rest and shade have reduced kidney injury in these settings. Because several exposures changed at once, they do not show how much of the benefit came from water alone.
The practical lesson is that an amount such as five litres can be appropriate or insufficient in one environment and excessive in another.
The Boston Marathon illustrates the opposite problem.
The Boston Marathon showed the upper side of the curve
In a classic study of the Boston Marathon, 488 runners provided usable blood samples after finishing the race.
Thirteen percent had hyponatraemia, defined as serum sodium of 135 mmol/L or less. Three runners, 0.6%, had critically low sodium of 120 mmol/L or less.
Weight gain during the race was one of the strongest risk factors. The adjusted odds ratio was 4.2.
During prolonged exercise, vasopressin may remain elevated because of exercise, pain, nausea, heat and other stress signals. The kidneys can therefore conserve water while the athlete continues drinking.
If intake exceeds losses and excretion, serum sodium becomes diluted.
At severe levels this can cause cerebral oedema, seizures, coma and death.
This sets a real upper limit to simple advice to “drink as much as possible”.
Is thirst enough?
The common statement that thirst appears only after significant dehydration is too simple.
Thirst regulation can act in advance.
Animal neuroscience shows that circuits controlling thirst respond to eating and drinking before blood chemistry has fully changed. Drinking around meals, before sleep or before expected water loss can be anticipatory.
Humans also drink for reasons beyond acute thirst: with food, after waking, before exercise and because drinks are available.
Normal water regulation therefore combines thirst, learned behaviour, meals, kidney conservation and hormonal signals.
For most healthy adults under ordinary conditions this appears to work reasonably well.
There are situations where the system is less reliable.
Ageing can weaken thirst responses. Illness and medication can change water and sodium regulation. Cognitive impairment or limited mobility can interfere with access to water. Heat and rapid sweat loss may require planned replacement. We look separately at when electrolyte replacement is actually useful.
This is why hydration advice has to remain contextual.
What can urine colour tell you?
Urine colour is useful as a rough everyday indicator of urine concentration.
Darker yellow urine usually means that the kidneys are conserving more water.
It does not directly measure a deficit of body water.
Morning urine is naturally more concentrated. Vitamins, foods and medicines can alter colour. Kidney function also affects concentrating ability.
Very pale urine simply means that urine is dilute.
There is no good evidence that maintaining almost transparent urine throughout the day is a general health objective.
So how much water should a healthy adult drink?
We did not find a good reason to replace the familiar two-litre rule with another universal number.
For a healthy adult in ordinary conditions, normal drinking in response to thirst, meals and daily habits is a reasonable baseline.
Total water matters more than plain-water volume alone.
Coffee and tea contribute water. Food contributes water. A person does not need to compensate for these sources by drinking the same amount again as plain water.
Requirements increase when losses increase, particularly with heat, exercise, fever, vomiting and diarrhoea. Pregnancy and breastfeeding also change water turnover.
For people with recurrent kidney stones, a deliberate urine-volume target may be appropriate. Women with recurrent cystitis who normally drink very little may benefit from increasing intake.
Heart failure, advanced kidney disease, disorders of sodium regulation and some medications can create the opposite situation, where excessive fluid intake is undesirable.
The useful question is therefore rarely “How many litres should every person drink?”
It is closer to: how much water does this person need under these conditions to replace losses and handle the physiological load?
What seems reasonably well established
Human water requirements vary too much for one amount of plain water to be an optimal prescription for everyone.
Official reference values generally refer to total water from food and beverages.
The kidneys can maintain relatively stable blood chemistry across quite different water intakes by changing urine volume and concentration.
Increasing water intake reliably changes hydration physiology. It can increase urine volume, reduce urine osmolality and lower copeptin.
Clinical benefit is clearest when there is a direct mechanism, especially in kidney-stone prevention.
Excessive intake can also be harmful when water is consumed faster than it can be lost or excreted.
Our first exploratory NHANES analysis did not find evidence that 500 mOsm/kg behaves as a special threshold where mortality or kidney risk suddenly worsens.
Our second NHANES analysis found that relatively low water intake has a real person-level component. Repeatedly low intake was also associated with more concentrated urine. A single 24-hour recall, however, misclassifies a substantial number of people relative to their intake several days later.
What remains uncertain
The main unresolved issue is whether chronic water conservation carries a meaningful long-term cost in otherwise healthy people.
Repeatedly low intake is associated with more concentrated urine.
Lower intake can increase vasopressin activity.
Higher copeptin is associated with several chronic diseases.
Some animal experiments show harm from chronic water restriction.
What is still missing is a convincing long-term human experiment showing that healthy people with persistently low intake and concentrated urine become healthier when they deliberately drink more.
Changing copeptin or urine osmolality cannot answer that question by itself.
The most interesting next question
At the beginning we asked:
How many litres of water should a person drink?
A better research question is now possible:
Among people who repeatedly drink relatively little and consistently conserve water, which are simply showing a normal physiological pattern, and which would actually benefit from drinking more?
The next trial should therefore not recruit random healthy adults.
It should first identify people with repeatedly low total water intake and repeated evidence of stronger water conservation.
Diet, kidney function, salt and protein intake, physical activity, temperature and body size should also be measured.
Then participants could be randomized to increased water intake or usual behaviour and followed for outcomes that matter clinically.
Our second NHANES analysis suggests that this population can, in principle, be identified.
The remaining question is whether changing its behaviour improves long-term health.
We do not yet know.
Selected primary sources and key reviews
- National Academies of Sciences, Engineering, and Medicine. Dietary Reference Intakes for Water, Potassium, Sodium, Chloride, and Sulfate. National Academies Press.
- EFSA Panel on Dietetic Products, Nutrition, and Allergies. Scientific Opinion on Dietary Reference Values for water. EFSA Journal. 2010;8(3):1459. doi:10.2903/j.efsa.2010.1459.
- Yamada Y, et al. Variation in human water turnover associated with environmental and lifestyle factors. Science. 2022;378:909–915. doi:10.1126/science.abm8668.
- Hakam N, et al. Outcomes in Randomized Clinical Trials Testing Changes in Daily Water Intake: A Systematic Review. JAMA Network Open. 2024;7:e2447621. doi:10.1001/jamanetworkopen.2024.47621.
- Borghi L, et al. Urinary volume, water and recurrences in idiopathic calcium nephrolithiasis: a 5-year randomized prospective study. Journal of Urology. 1996;155:839–843.
- Desai AC, et al. Prevention of urinary stones with hydration: a randomised clinical trial of an adherence intervention. The Lancet. 2026;407:1171–1181. doi:10.1016/S0140-6736(25)02637-6. A published correction appeared in August 2026.
- Hooton TM, et al. Effect of Increased Daily Water Intake in Premenopausal Women With Recurrent Urinary Tract Infections: A Randomized Clinical Trial. JAMA Internal Medicine. 2018;178:1509–1515. doi:10.1001/jamainternmed.2018.4204.
- Clark WF, et al. Effect of Coaching to Increase Water Intake on Kidney Function Decline in Adults With Chronic Kidney Disease: The CKD WIT Randomized Clinical Trial. JAMA. 2018;319:1870–1879. doi:10.1001/jama.2018.4930.
- Perrier ET, et al. Twenty-Four-Hour Urine Osmolality as a Physiological Index of Adequate Water Intake. Disease Markers. 2015. doi:10.1155/2015/231063.
- Perrier ET, et al. Hydration for health hypothesis: a narrative review of supporting evidence. European Journal of Nutrition. 2021;60:1167–1180. doi:10.1007/s00394-020-02296-z.
- Kitiwan BK, et al. The association of urine osmolality with decreased kidney function and/or albuminuria in the United States. BMC Nephrology. 2021. doi:10.1186/s12882-021-02478-9.
- Almond CSD, et al. Hyponatremia among Runners in the Boston Marathon. New England Journal of Medicine. 2005;352:1550–1556. doi:10.1056/NEJMoa043901.
- Allen MD, et al. Suboptimal hydration remodels metabolism, promotes degenerative diseases, and shortens life. JCI Insight. 2019;4:e130949. doi:10.1172/jci.insight.130949.
- van Dam E, et al. Sugar-Induced Obesity and Insulin Resistance Are Uncoupled from Shortened Survival in Drosophila. Cell Metabolism. 2020;31:710–725.e7. doi:10.1016/j.cmet.2020.02.016.
- Majdi M, et al. Total and drinking water intake and risk of all-cause and cardiovascular mortality: A systematic review and dose-response meta-analysis of prospective cohort studies. International Journal of Clinical Practice. 2021;75:e14878. doi:10.1111/ijcp.14878.
- The Null Institute exploratory analyses of NHANES 2011–2012. One analysis examined urine osmolality, kidney measurements and linked mortality; the second examined two-day total water intake and spot urine osmolality. These analyses have not undergone peer review and are presented as exploratory tests of specific hypotheses rather than independent clinical evidence.