
In one international study, Egypt ranked 21st out of 22 countries when people were asked to place their lives on a ladder, and third when the same people were asked how satisfied they were with life. Nobody had moved. Nothing about the country had changed. Only the question had. [3]
Finland, meanwhile, tops the World Happiness Report 2026. If you are considering moving there, that sounds almost like a promise. But does a high national score predict what will happen to your life? The answer turns out to be more interesting than either “yes” or “happiness rankings are meaningless”.
This is not an attempt to crown a different winner. It is an investigation into what a country can change, what questionnaires can measure, and why the distinction matters when the decision is where to live.
Contents
- What the happiness ranking actually measures
- One country, three different answers
- The hidden problem with numbers
- What a ranking misses about an ordinary day
- What people expect from the future
- The migration test
- Our own exploratory checks
- Should you move to a happier country?
- Frequently asked questions
- Methods and sources
What Finland’s Happiness Ranking Actually Measures
Finland’s 2026 score is 7.764 out of 10. The question behind it is not “Did you laugh yesterday?” Respondents imagine a ladder running from the worst possible life to the best possible life for them and choose where their lives stand today. This is the Cantril Ladder. The World Happiness Report averages these answers from 2023–2025 to produce its principal ranking. Income, social support and health are examined as possible explanations; they are not mechanically assembled into Finland’s score. [1]
That is a legitimate measure of something important. But evaluating an entire life is not the same mental act as experiencing a Tuesday. A person can feel secure about work and family while spending a difficult week in pain or under pressure. Another can enjoy the day yet worry about the future. Daniel Kahneman and Angus Deaton famously examined this distinction in US data, finding different associations for life evaluation and everyday emotions. [18]
The point is not that the ranking is fake. It is that its name tempts us to ask it a question it was never designed to answer.
The Same People, Three Different Answers
In a Scientific Reports study published in 2026, Tim Lomas and colleagues compared the Cantril Ladder, life satisfaction and a general happiness question among 202,898 people in 22 countries. When we recalculated the ranks from their published country means, Egypt placed 21st on the ladder but third for life satisfaction. Sweden placed second on the ladder and ninth for life satisfaction. Those are positions within these 22 countries, not in the global WHR league table. [3]
Its position changes dramatically depending on what people are asked to rate.
EDITOR’S NOTE
Averages hide the individual
A country’s average cannot tell you how its residents are distributed. Two countries can share the same mean while one has mostly similar responses and the other is deeply divided. Rankings conceal that difference.
The study contains another startling contrast. Across the same 22 countries, GDP per person correlated 0.58 with average ladder scores, but only 0.05 with life satisfaction and −0.08 with general happiness. These are country-level correlations from this study, not causal effects or universal constants. [3, Table 16]
Survey measure Correlation with GDP per person across 22 countries Cantril Ladder +0.58 Life satisfaction +0.05 General happiness −0.08
It would be a mistake to conclude that life satisfaction “has nothing to do with money”. Individual financial security and national GDP are not the same variable, and the sample contains just 22 countries. What the contrast does show is that changing the wording changes what the score is especially sensitive to.
This finding did not begin with us. Christopher Barrington-Leigh examined the comparability of life-satisfaction and ladder questions using Gallup, the Global Flourishing Study and the World Values Survey. His 2025 preprint argues that their international distributions and rankings diverge in ways not easily explained by a single correction. [19] The same concern now sits at the centre of the happiness debate, rather than on its margins.
The Hidden Problem With a Number From Zero to Ten
Think of two equally satisfied customers. One gives a restaurant five stars because nothing went wrong. The other reserves five for a transcendent meal and gives four. Averaging thousands of such judgements creates a difference even if the experiences are similar. Across countries, the problem is larger: different languages, comparison groups, question formats and ways of using a numerical scale can all play a part.
This is not a newly discovered flaw. Gary King and colleagues developed anchoring vignettes to investigate how respondents interpret response categories. Bond and Lang later showed how strong the assumptions must be when researchers compare group averages of ordinal happiness scales. Neither result means all survey evidence is unusable; both show why a decimal point can convey more certainty than the measurement warrants. [20, 21]
EDITOR’S NOTE
A number is not a feeling
Two people can experience similar wellbeing and still use a 0–10 scale differently. Response tendencies can affect comparisons; there is no universally validated formula that recovers each country’s ‘true’ score.
We explored the same problem in the Global Flourishing Study. Using 18 additional 0–10 questions and a separate seven-point personality scale, we estimated tendencies to select endpoints or middles. In one adjustment, the rank agreement between the ladder and general happiness rose from approximately 0.68 to 0.90. [A2]
That large change is intriguing, but it is not a validated correction of the world ranking. Subtracting a shared country component can itself make measures converge; the auxiliary questions reflect real experiences as well as reporting habits. Our result is a sensitivity test with unresolved identification problems, not a measurement of each country’s “true happiness”. The cultural implication is equally important: an individual score does not establish a national temperament.
A Good Life and a Good Day Are Not the Same
The WHR also asks about experiences during the previous day: enjoyment, laughter, worry, sadness and other states. These answers bring us closer to everyday life but do not capture every moment or the intensity of each emotion. Across 147 countries and territories in the 2026 statistical appendix, our comparison of country averages found a correlation of approximately −0.37 between positive and negative experience indices. [1; A1]
Countries where positive experiences are more common tend, on average, to report fewer negative experiences, but the relationship is far from perfect. A place may be emotionally intense, with plenty of both, or relatively quiet, with little of either. Collapsing these two dimensions into a single score erases that difference.
Positive and Negative Emotions by Country: An Emotional Map
Source: World Happiness Report 2026 statistical appendix, 2023–2025. Published data; 147 countries and territories.
This interactive map uses published WHR means, not a sample of people observed smiling on the street. A country dot tells us about an aggregate; it cannot tell us whether the same individual felt both joy and stress yesterday.
The Gap Between Life Today and Hopes for Tomorrow
A high present-life score can coexist with modest expectations of improvement. A lower present score can coexist with enormous hope. An international happiness table conceals this difference if it publishes only the present. Lomas and colleagues assembled published Gallup measures for 145 countries and territories, which we use to plot current and expected future life evaluations separately. [11]
The second explorer deliberately offers two views: the two original scores, and the expected improvement calculated by subtracting one from the other. Neither is an objective measurement of how much better life will actually become.
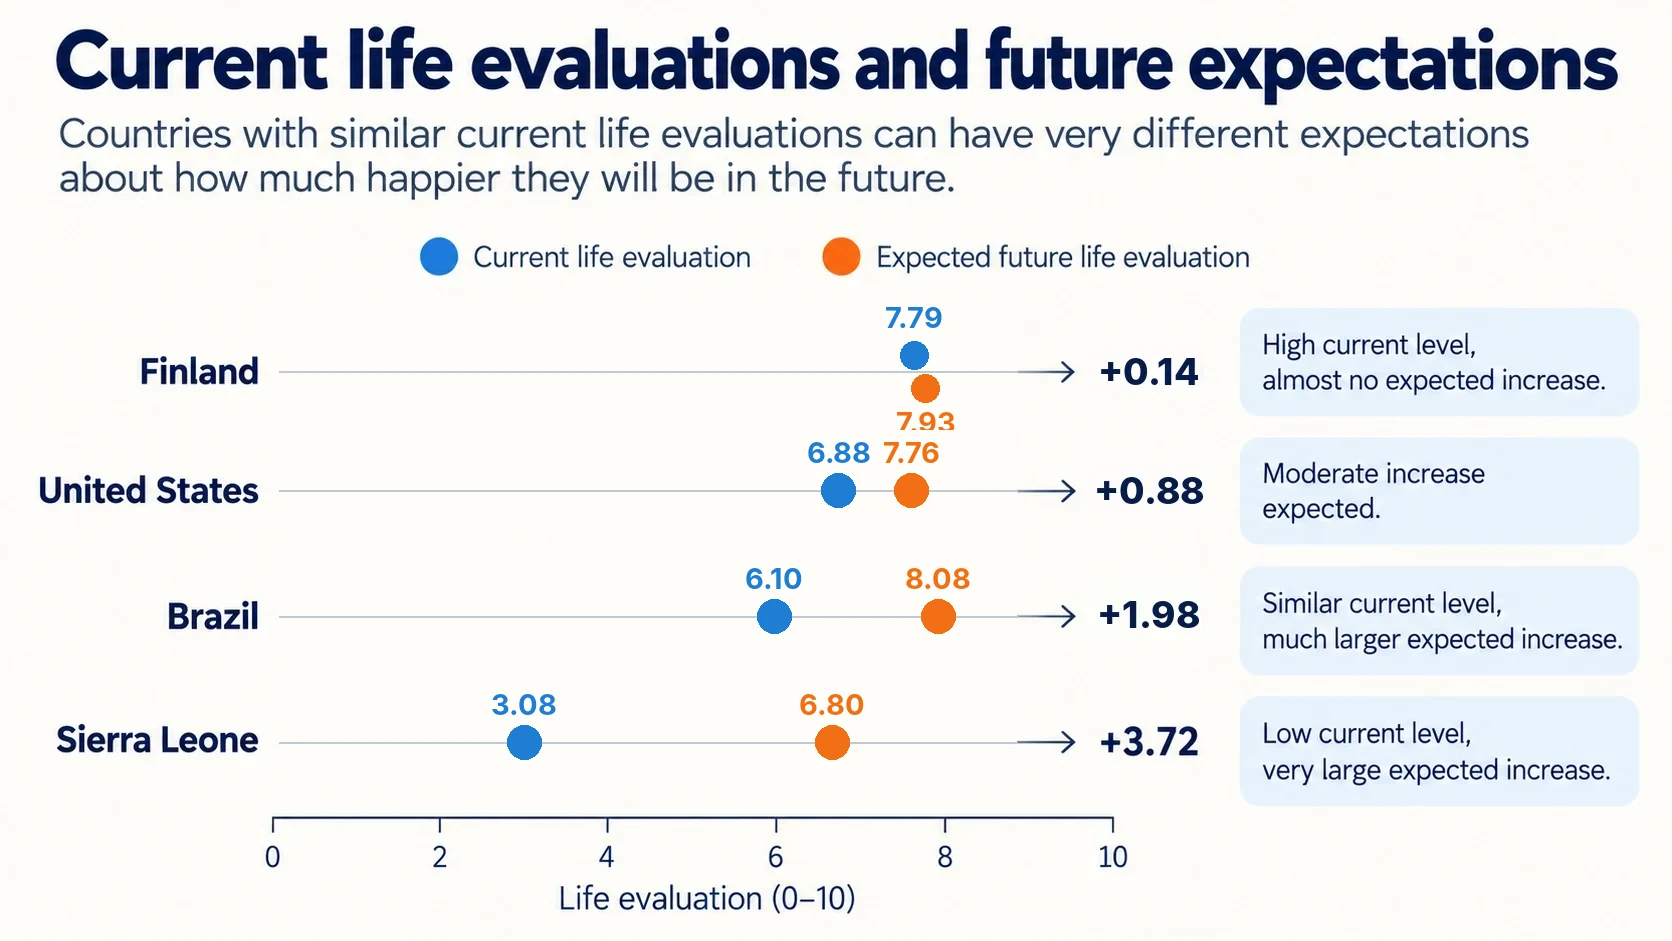
Current and expected future life evaluations, based on Gallup country means for 2020–2022. Expected change is not an observed outcome. [11] View the full-size infographic.
Current vs Future Life Evaluation by Country
Source: Gallup World Poll 2020–2022 values published by Lomas et al.; 145 countries and territories. Expected improvement = Future Cantril − Current Cantril, calculated from published rounded means. It is an expectation, not a forecast.
We also tried a historical reality check. Matching early published Gallup country means to later averages in an approximate 2010–2012 window, we found that expected future scores exceeded the subsequently observed national mean in 132 of 137 countries. The mean absolute error was about 1.30 points, compared with approximately 0.37 for a simple “today’s mean stays unchanged” benchmark. [A4]
It is a striking exploratory result, not proof that individuals are poor forecasters. Dates and country samples are imperfectly matched, the series is based on rounded published aggregates, and a question about future life may express hope rather than an explicit statistical prediction. Gallagher and colleagues had already documented the wide reach of optimism across countries. [12] Our comparison asks a different, narrower question about later country averages; it still needs independent replication.
The Real Test: What Happens When People Move?
EDITOR’S NOTE
A ranking is not your forecast
Migrants’ wellbeing can change when their surroundings change, but not always in the same direction. The visa-lottery study from Tonga to New Zealand found improved material conditions alongside a decline in one happiness measure. [17]
Here the abstract argument becomes a decision someone may actually face. Migrants change their institutions, jobs, housing costs, language, social networks and, often, legal security. If national conditions contribute to life evaluation, moving should sometimes change the answer. But “sometimes” matters.
In a 2015 review of 44 studies involving more than 70,000 migrants, Martijn Hendriks concluded that migrants can become happier, but outcomes depend strongly on the migration route; on average, migrants often did not reach the same reported wellbeing as people born in the destination. [22]
A study by John Helliwell, Hugh Shiplett and Aneta Bonikowska examined immigration to Canada and the United Kingdom. Immigrants’ life-satisfaction levels and distributions were often much closer to those of people in their new country than those in their country of birth. The observation makes a permanently fixed personal happiness set point difficult to defend, although migration selection remains a serious concern. [15]
Two studies bring the dilemma much closer to actual lives. In Finland, researchers met 225 Ingrian Finnish migrants from Russia while they were attending Finnish-language courses before departure. They surveyed them again six months, two years and three years after the move. Life satisfaction rose by the first follow-up and then largely stabilised, while self-esteem declined over the study. Only 85 participants remained at the three-year assessment, an important reminder that following people across borders is difficult. The findings describe this particular group, not every person moving to Finland. [16]
In the Pacific, applicants from Tonga entered a lottery for the chance to move to New Zealand. That unusually useful comparison allowed researchers to look beyond the differences between people who freely choose to emigrate and those who remain. Winners who migrated enjoyed substantially better material circumstances and reported improved mental health, yet their answers to a happiness question moved in the opposite direction. Even their sense of social respect depended on whether the researchers asked for a retrospective judgement or compared lottery groups. A change of country did not move every dimension of wellbeing together. [17]
Considering a move abroad?
Compare what may actually change when you move from one country to another, including purchasing power, work, health, safety, bureaucracy and life satisfaction.
Our European Migration Check
To see whether published patterns appeared in a broader European comparison, we examined European Social Survey rounds 1–11: roughly 541,000 responses, including around 50,000 people born outside the surveyed country. The route-specific analytic samples were much smaller. In several specifications, migrants’ mean life satisfaction lay roughly two thirds of the way between the origin-country and destination-country means. [A5]
That fraction describes group positions. It does not mean every migrant personally gained two thirds of the difference, nor that a country caused two thirds of an individual’s happiness. ESS is mainly repeated cross-sectional data. People select into migration, and those who return are poorly represented.
We also compared responses to 19 other ESS scales. Adjusting for indicators of midpoint and endpoint use changed a migration-convergence coefficient from approximately 0.74 to 0.62. This is compatible with a reporting-style contribution, but it cannot identify how much of the difference is mere measurement rather than substantive change. [A5]
Finally, for 34 migration routes and 101 route-by-round observations, a leave-one-route-out comparison produced prediction errors of about 0.49 points using differences in residents’ life satisfaction, 0.70 using a short set of external indicators, and 0.47 using both. The 0.49-versus-0.47 difference is too small to celebrate; none of these models predicts a particular individual’s future. [A5]
Still, a useful principle survives: what people say about their lives contains information that is not always captured by a small bundle of economic indicators. We should not dismiss national self-reports simply because they are imperfect.
As migration researcher Martijn Hendriks remarked in a published Erasmus University interview about how people judge their lives: “Once your basic needs are met, happiness becomes more and more relative.” [23] He was discussing the psychology of comparison, not commenting on our migration analysis. After a move, both people’s material circumstances and the groups they compare themselves with may change.
What Our Other Exploratory Checks Added
A scientific feature should not bury useful failed experiments. In our two-wave GFS comparison of about 128,000 respondents retained across waves, the one-year correlations were approximately 0.50 for life satisfaction, 0.47 for general happiness and 0.45 for the ladder. The gaps were small. They did not support the neat idea that one measure simply reflects a permanent inner trait while another reflects external conditions. [A2]
An independent look at time-use data produced an even more seductive result: for 11 European countries, commuting time and the national life-evaluation ranking had a rank correlation near −0.96. A wonderfully tidy theory presented itself: shorter commutes produce happier societies. But time-use surveys covered different years, only 11 countries were included, and we had examined several activity categories. Checks using changes over time in Poland and Norway did not sustain a simple commuting story. That number belongs in the article precisely because the initial interpretation did not survive. [A3]
We also examined the appeal of seemingly objective substitutes for asking people how they feel. Published reviews have not established a single blood marker, physiological measurement or behavioural proxy that can serve as a universal happiness meter. A precise measurement is not necessarily a valid measurement of the thing we care about. [8]
So, Can a Country Make You Happier?
Yes, a country can change circumstances that contribute to wellbeing. No, its place in a happiness ranking is not a reliable personal forecast. Both halves matter. The first is supported by migration research; the second follows from variation between people, different wellbeing measures and the limits of national averages.
Before choosing a destination, use the ranking as a first clue. Then ask a more specific set of questions: How do people with my background fare there? What would change about work, housing, safety, health care, language and relationships? What do we know from migrants who stayed, and from those who returned? The relevant comparison is not Finland versus every other country in a single column. It is your plausible life there versus your plausible life elsewhere.
This investigation began with a country that was almost last and near the top at the same time, depending on the question. It ends with a less spectacular, more useful conclusion: the best-ranked country is not necessarily the country in which your own life will improve most. A ranking is worth reading. It is not worth surrendering your judgement to.
Frequently Asked Questions About Happiness Rankings
What does the World Happiness Report actually measure?
Its main ranking is based on the Cantril Ladder, a 0–10 life-evaluation question about where people place their current life between the worst and best possible life for them. It is not a direct count of smiles, daily pleasure, or positive emotion. That distinction is one reason different measures of subjective well-being can produce different country rankings.
Is Finland really the happiest country in the world?
Finland ranks first in the World Happiness Report 2026 on average life evaluation. That does not mean every Finnish resident is happier than every person elsewhere, or that Finland must rank first on every measure of daily emotion, meaning, optimism, or life satisfaction. The answer depends on what “happiest” is intended to mean.
Will moving to another country make you happier?
There is no universal guarantee. Published studies of migrants to Canada, the United Kingdom and elsewhere show that destination conditions can matter; our exploratory European comparisons find related patterns. But migrants are self-selected, circumstances differ, return migration is hard to observe, and part of the shift may reflect changes in how people use rating scales. For an individual decision, national averages are only one input.
Why do happiness rankings differ between surveys?
Because surveys may ask different questions and therefore measure different psychological constructs. Life evaluation, life satisfaction, general feelings of happiness, positive emotion, negative emotion, meaning, and expectations overlap, but they are not interchangeable. Sampling periods, populations, wording, and response styles can add further differences.
Are international happiness rankings culturally biased?
Cross-country happiness comparisons can be influenced by cultural and individual response styles, such as preferring the middle of a scale or using extreme values more readily. Our exploratory sensitivity tests found that adjusting for these tendencies made several wellbeing rankings more similar, but those tests are not a validated national correction. That does not prove a simple cultural-bias correction exists, because the same response patterns can also contain real differences in experience.
Can happiness be measured objectively without surveys?
Objective measures such as sleep, commuting time, physiology, income, or observed behaviour can add useful information, but none is a complete substitute for reported experience. A precisely measured variable can still be only an indirect proxy for wellbeing. The strongest picture usually comes from combining self-report with independent behavioural, biological, and environmental measures.
Can people accurately predict their future happiness?
In our preliminary historical comparison of country averages, expected future scores were poor predictors of later means. Average five-year expectations were usually more optimistic than later observed life evaluations, and larger expected improvements did not clearly predict larger subsequent gains. These aggregate results do not establish how accurately a particular person can predict their own future wellbeing.
Methods and sources
How We Combined Published Evidence With Our Analyses
The primary scientific claims in this feature come from identified published studies and their cited datasets. Numerical results marked A1–A5 are additional Mike’s Balance exploratory calculations. They have not undergone independent peer review, and a complete runnable reproduction package is not currently available with this article. We therefore report them as sensitivity checks and descriptive findings, not as independently established mechanisms or a new definitive ranking.
A1 · Emotions. WHR 2026 published country/territory averages (2023–2025), n=147. The cross-country correlation is ecological; it cannot reveal within-person co-occurrence of emotions.
A2 · GFS and response scales. Waves 1–2 and longitudinal survey weights; approximately 128,000 two-wave participants. The 0.68→0.90 result comes from a model using other rating-scale items and is vulnerable to shared-component subtraction. Results are not equivalent to an anchoring-vignette calibration; survey attrition and real content in auxiliary responses matter.
A3 · Time use. HETUS summaries, 11 countries, non-aligned periods. Multiple examined activity categories and tiny country-level n make −0.96 vulnerable to selection and confounding; within-country observations failed to sustain a simple causal interpretation.
A4 · Future life. Published historical Gallup means matched approximately to a later 2010–2012 national average for 137 countries, rather than the same people surveyed again after precisely five years. Mean absolute errors compare published aggregates with a simple persistence benchmark; hope and statistical prediction must not be conflated.
A5 · Migration. ESS rounds 1–11, matching origin and destination within survey rounds; adult-arrival restrictions in sensitivity checks. Estimates depend on route/sample specification. The 0.74→0.62 change may remove real differences along with response tendencies. Prediction comparison: 34 routes and 101 route-round observations; leave-one-route-out validation, with uncertainty not yet established. None of these data provide an individual’s migration counterfactual.
Across all analyses, category ratings are ordinal approximations; apparent precision should not be mistaken for certainty. These notes enable scrutiny of the claims but are not a substitute for posting scripts, data versions and executable workflows.
Primary Data and Research Sources
[1] World Happiness Report 2026. Methodology of the main ranking and emotion measures: Chapter 2, statistical appendix, including Figures 40–45, official Finland data.
[2] Aristotle; Epicurus. Primary philosophical texts: Nicomachean Ethics, Book I; Letter to Menoeceus. Historical context, not empirical evidence for modern psychological models.
[3] Lomas T. et al. (2026). Exploring associations of three evaluative subjective wellbeing measures (Cantril’s ladder, life satisfaction, happiness) with 15 childhood and demographic factors across 22 countries. Scientific Reports, 16, 8025. DOI and full text. Table 3 provides country means and distributions; our longitudinal analyses in A2 are not part of this publication.
[4] Nilsson A. H. et al. (2024). The Cantril Ladder elicits thoughts about power and wealth. Scientific Reports, 14, 2642. Full text.
[5] Blanchflower D. G., Bryson A. (2024; online 2023). Wellbeing Rankings. Social Indicators Research, 171, 513–565. DOI and full text.
[6] Global Flourishing Study. Wave 1 and Wave 2 source data and documentation used in our analyses: official access page. Questionnaire description: Lomas et al., The development of the Global Flourishing Study questionnaire.
[7] Bartels M. (2015). Genetics of Wellbeing and Its Components Satisfaction with Life, Happiness, and Quality of Life: A Review and Meta-analysis of Heritability Studies. Full text. Additional direct comparison of scales: Bartels M., Boomsma D. I. (2009), Born to be Happy? The Etiology of Subjective Well-Being. Full text.
[8] de Vries L. P., van de Weijer M. P., Bartels M. (2022). The human physiology of well-being: A systematic review on the association between neurotransmitters, hormones, inflammatory markers, the microbiome and well-being. Neuroscience & Biobehavioral Reviews, 139, 104733. Publication.
[9] Eurostat, Harmonised European Time Use Surveys — HETUS 2020. Activity classification, survey periods, and comparability limitations: metadata; table tus_20age.
[10] Statistics Poland. Time use survey in 2023, including comparisons with 2013: publication and tables. Our comparisons with WHR are described in A3.
[11] Lomas T. et al. (2025; online 2024). A multidimensional assessment of global flourishing: Differential rankings of 145 Countries on 38 wellbeing indicators in the Gallup World Poll, with an accompanying factor analysis of the structure of flourishing. The Journal of Positive Psychology, 20(3), 397–421. DOI; author version with supplementary tables.
[12] Gallagher M. W., Lopez S. J., Pressman S. D. (2013). Optimism Is Universal: Exploring the Presence and Benefits of Optimism in a Representative Sample of the World. Journal of Personality, 81(5), 429–440. DOI; author publication. Used as a source of early current and future life evaluations; the later comparison is our analysis A4.
[13] Crabtree S., Diego-Rosell P., Buckles G. / Gallup, GSMA (2018). The Impact of Mobile on People’s Happiness and Well-Being. Technical report with historical series. We use the life-evaluation series, not the report’s conclusions about mobile technology.
[14] European Social Survey. ESS1–11 source surveys and ESS Multilevel Data 2025: official data portal. Conclusions in A5 are analyses from our project and are not attributed to ESS.
[15] Helliwell J. F., Shiplett H., Bonikowska A. (2020). Migration as a test of the happiness set-point hypothesis: Evidence from immigration to Canada and the United Kingdom. Canadian Journal of Economics. DOI. For broader international comparison, see also World Happiness Report 2018, Chapter 3 and Appendix, Table A6.
[16] Lönnqvist J.-E. et al. (2015). The mixed blessings of migration: Life satisfaction and self-esteem over the course of migration. European Journal of Social Psychology. DOI; description of the Ingrian-Finnish Remigrants 2008–2013 data.
[17] Stillman S., Gibson J., McKenzie D., Rohorua H. (2015). Miserable Migrants? Natural Experiment Evidence on International Migration and Objective and Subjective Well-Being. World Development, 65, 79–93. Publication; author version.
[18] Kahneman D., Deaton A. (2010). High income improves evaluation of life but not emotional well-being. PNAS. DOI and full text.
[19] Barrington-Leigh C. P. (2025). Are international happiness rankings reliable? arXiv preprint (not peer reviewed as a journal article at the time cited). Preprint.
[20] King G., Murray C. J. L., Salomon J. A., Tandon A. (2004). Enhancing the Validity and Cross-Cultural Comparability of Measurement in Survey Research. American Political Science Review. DOI.
[21] Bond T. N., Lang K. (2019). The Sad Truth about Happiness Scales. Journal of Political Economy. DOI.
[22] Hendriks M. (2015). The happiness of international migrants: A review of research findings. Migration Studies, 3(3), 343–369. DOI.
[23] Erasmus University Rotterdam (2025). This is how we can make Rotterdam happy, interview with Martijn Hendriks. Original interview. The quotation concerns life evaluation and social comparison, not a direct comment on Mike’s Balance findings.