
There’s an easy way to win an argument once you’ve run out of arguments. Tell the other person they’re a textbook case of the Dunning–Kruger effect. They understand so little about the subject that they don’t even realize how incompetent they are. The more confidently they object, the clearer the diagnosis. And any attempt to defend themselves can be dismissed as another symptom.
The label sounds scientific, but the research behind it tells a more complicated story. Psychologists did find that people who performed poorly on certain tests tended to overestimate their standing relative to others more than better performers did. They proposed a psychological explanation and found experimental evidence for it. Later work showed that a similar pattern can arise for other reasons, including the way the measurements are made.
What these studies cannot do is tell us how well someone understands a subject from how confidently they argue about it.
In August 2026, a fairly radical biotechnology proposal was being debated on Hacker News. One commenter replied that the author’s name belonged in the dictionary next to the Dunning–Kruger effect [1]. The reply offered no analysis of the proposal, and no argument against it. Apparently, two surnames were supposed to be enough.
Where did the “Mount Stupid” graph come from?
You’ve probably seen the diagram. Someone barely acquainted with a subject races straight up to the summit of self-confidence: “Mount Stupid”. Next comes the “Valley of Despair”, followed by the long climb up the “Slope of Enlightenment”.
Handy graph. Almost anyone you find irritating in an argument fits somewhere on it, preferably near the top.
But that picture never appeared in Justin Kruger and David Dunning’s 1999 paper [2]. They did not study how one person’s confidence changes as they learn. Instead, they gave different people tests of humor, grammar and logic, then asked them to rate their abilities relative to the other participants.
In the first experiment, participants in the bottom quarter of the results were around the 12th percentile, yet placed themselves near the 58th. A percentile marks your position within a group: at the 20th percentile, roughly 20% of participants scored below you.
The better-performing participants also rated themselves more highly, but their ratings rose far more slowly than their actual results. The study found no necessary peak in overconfidence among beginners.
Kruger and Dunning suggested that doing a task well and recognizing your own mistakes draw partly on the same skills. A novice chess player may fail to see a checkmate three moves ahead. Their confidence need not be arrogance. They may simply lack the knowledge to see the danger.
In one experiment, the psychologists trained participants in logical reasoning. Afterwards, the participants’ self-assessments became more accurate. That is meaningful evidence for the proposed mechanism. It would be unfair to reduce the 1999 paper to one contentious graph.
Other researchers eventually began testing more prosaic explanations for the curve, starting with the measurements themselves.
Learning something doesn’t mean you understand it
So what’s really at stake in the argument over those graphs? Despite access to objective measures (test results) and subjective ones (people’s own view), there are still limits to our ability to explain others’ errors. Still, it seems easy to judge a stranger’s competence from a single confident comment online.
Knowing a subject and knowing the limits of your knowledge are two different things.
One thing that we all learned at school was that the square root of a negative number is undefined.
This will likely have been committed to memory, resulting in a passing grade (probably with flying colours). At this point, the pupil would presumably want to inform others of this “fact”. However, if a university lecturer then informed the student that there were answers to the equation x² = −1, they would likely take exception. That can’t be right, they’d think. It contradicts what they learned at school.
Well of course the answer depends on which set of numbers we’re considering. Within the reals, there are no solutions. If we broaden the scope to include the complex numbers, then we find 2 solutions: i and −i, where i² = −1.
Naturally, the lecturer will know that within the set of real numbers the student was taught, this remains true. However, once we step outside that boundary, additional solutions become possible.
The student may have retained the rule faithfully, but failed to grasp that it applies only within a particular mathematical framework. The rule is correct; the conclusion they’ve drawn from it isn’t.
This case fits Kruger and Dunning’s original hypothesis rather well. An individual can lack the knowledge both to arrive at the correct solution and to recognize their own mistake. This is the “double burden” of incompetence. And a specialist can fall into the same trap when they venture beyond their training without noticing. So invoking the Dunning–Kruger label explains nothing by itself. We still need to show where the reasoning actually breaks down.
This is the distinction I keep coming back to in arguments about expertise. Someone studies a field, learns the definitions, passes the exams, earns a degree and qualifies to practice. By the established criteria, they are competent. But how good are they at questioning those criteria, spotting hidden assumptions and looking beyond the model they know?
Professional standing is a reason to trust a specialist: it reflects training, practice and qualification requirements. It is not proof that every conclusion they draw is correct. A doctor can get a diagnosis wrong, a mathematician can overlook a false assumption, and a researcher can make more of their own data than the evidence warrants.
A particular claim still has to stand on its evidence, not the author’s biography.
The diagram below separates subject knowledge from the ability to check a line of reasoning independently.
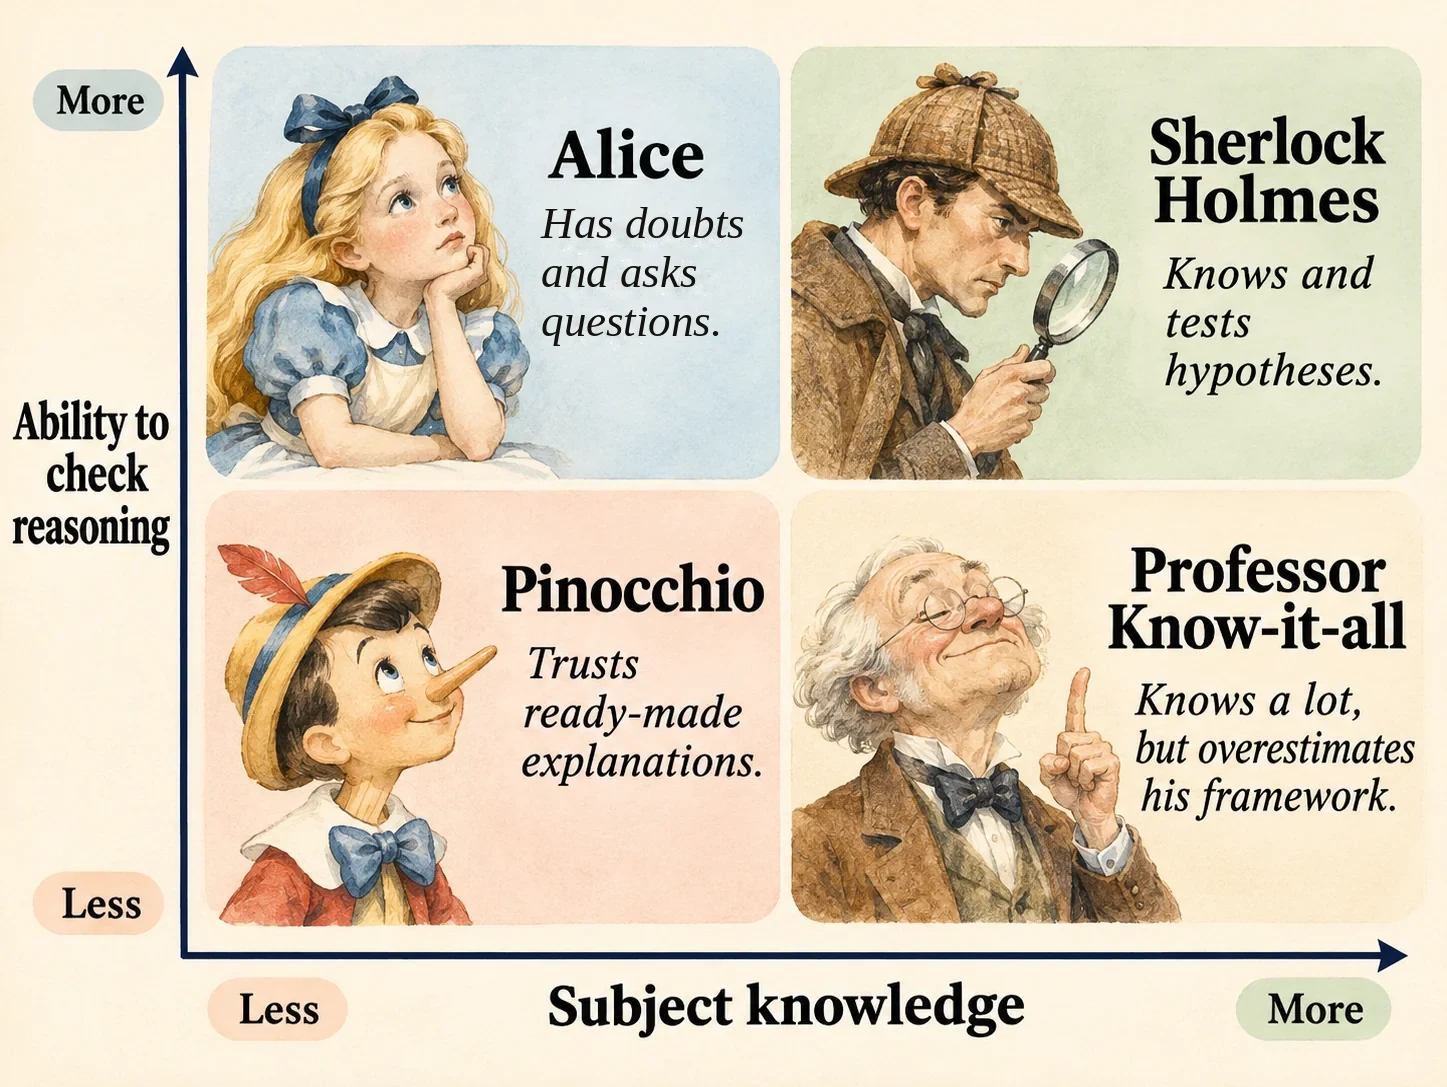
In practice, both skills matter. Knowledge saves us from rediscovering what has already been tested. Independent reasoning helps us notice when conditions have changed or a familiar explanation has missed something important.
An objection from someone without formal training might expose an expert’s mistake. Or it might fall apart as soon as it encounters facts established long ago. The only way to tell is to examine the objection itself.
Confidence alone will not tell us who understands the subject better. A math professor may be absolutely certain that complex numbers exist, with excellent reason. A student may be just as certain of the opposite if they take a school rule to apply to all of mathematics.
How statistics can make people look overconfident
Imagine two people who are equally well prepared. Both answer 70% of questions correctly on average. One gets an unlucky set of questions and scores 60%; the other has better luck and scores 80%. Both estimate their ability at 70%. Who has overestimated themselves? Neither, really. But compared with this particular test result, the first will look “overconfident” by 10 percentage points, while the second will look “overly modest” by the same amount.
Now divide people into groups by their test scores. The group at the bottom will contain more people who had bad luck; the group at the top, more who had good luck. The familiar graph begins to appear: poorer performers seem to overestimate themselves, while stronger performers underestimate themselves. Yet in our example, nobody misjudged their underlying ability.
There is an arithmetic trap here, too. Take “self-assessment error”: subtract the test score from the self-assessment, then compare that difference with the very test score you just subtracted. If self-assessment stays constant, every additional 10 test points automatically reduces the calculated “error” by 10. The same number is doing double duty.
None of this makes the Dunning–Kruger effect entirely imaginary. It means that the shape of a graph cannot, by itself, tell us what caused it. Joachim Krueger and Ross Mueller raised this issue [3]. The roles of random noise and measurement were investigated by Nuhfer and colleagues [4] and by Gignac and Zajenkowski [5].
One small twist: Justin Kruger, co-author of the 1999 paper, and Joachim Krueger, author of the 2002 critique, are different people. Otherwise, it might look as though Kruger changed his mind three years later and refuted himself.
Blair Fix obtained a similar curve even from random variables [6]. But his model assumes from the outset that self-assessment is unrelated to performance. It is a useful mathematical test, not a model of how actual people behave, as critics pointed out [7]. Meanwhile, Jansen and colleagues found evidence that poorer performers really are less responsive to information about their own errors [8].
The graph exists. The question is how much of its shape reflects psychology and how much comes from the way performance is measured. That takes more data, not guesses about the participants’ personalities.
One test, two very different ways to rate yourself
What does it mean to “overestimate yourself”? To get the number of your correct answers wrong, or to misjudge how well everyone else did? They sound much the same. In practice, they measure different things.
In a 2022 experiment by McIntosh and colleagues, participants completed matrix-reasoning problems, then estimated both how many they had answered correctly and where they stood among other students [9]. At The Null Institute, we independently recalculated the published data for 151 participants [10]. Here are the results for the 38 participants in the bottom quarter of the preliminary test:
| What participants estimated | Their estimate | Actual result |
|---|---|---|
| Percentage of answers correct | 76.0% | 76.1% |
| Rank relative to others (percentile) | 51.2 | 19.8 |
The first row is almost an exact match. In the second, the gap is 31.4 percentile points. On average, the same people came very close when estimating how many questions they had answered correctly, yet greatly overestimated where they stood among their peers.
But that near-perfect match exists only on average. Of the 38 people, 22 overestimated the number they got right, 14 underestimated it, and two got it exactly right. Their mean absolute error was 7.7 percentage points. Errors in opposite directions partly canceled one another out.
There is a limit to that comparison. Participants estimated their standing among students at the University of Edinburgh, while we calculated their actual percentile within the study sample. The self-assessment scale was also unusual: zero meant 50% correct, the level expected from random guessing. The reanalysis accounts for that scale, although we cannot know how each participant understood it [9], [10].
Across the full sample, participants actually underestimated their scores by an average of 7.64 percentage points. The association between performance on the preliminary test and self-assessment error nevertheless remained negative. In the top quarter, the mean score was around 97%: there was hardly any room to overestimate it, but plenty of room to underestimate it.
Accuracy and rank are not interchangeable. Someone can estimate their own score quite well while badly misjudging their standing relative to others. The difference between absolute and relative self-assessment has long been recognized [11]. What we have done is independently check a particular dataset, not discover a new psychological effect. The detailed tables, methods and code are in The Null Institute’s research note.
When experts change their advice
During the COVID-19 pandemic, the gap between knowing something, understanding it and deciding what to do became especially clear.
Vaccine safety, infection risks and whether particular measures made sense required different kinds of evidence. Yet recommendations were often treated as settled answers that non-specialists were simply expected to accept. Questions could be put down to the questioner’s supposed incompetence rather than addressed on their merits.
The AstraZeneca vaccine shows why that approach can fail.
After mass vaccination began, reports emerged of a rare combination of blood clots and low platelet counts. On 7 April 2021, the UK’s Joint Committee on Vaccination and Immunisation (JCVI) recommended that adults under 30 without additional risk factors be offered an alternative vaccine where one was available [12].
The change reflected new evidence about a serious adverse event and the balance of benefits and risks for that particular group.
What bothers me in cases like this is not the revision of the advice. Specialists should change their recommendations when new evidence warrants it. The problem is using qualifications as a shield against questions.
A person without medical training can raise a well-founded concern or a mistaken one. We need to assess the concern itself against the available evidence. Calling the person incompetent, or invoking Dunning–Kruger, still does not answer the question.
So who is actually competent?
Even the word “competence” can get in the way. Instead of examining a particular mistake, we quietly shift to judging the whole person.
Kruger and Dunning studied the relationship between performance on specific tasks and participants’ beliefs about their own abilities. Their research does not allow us to infer how deeply someone understands a subject from a single confident comment. Nor does it justify treating every disagreement with an expert as evidence of a psychological defect.
You can see the problem in their own 1999 data. In the second experiment, the bottom quarter on the logic test averaged around the 12th percentile, while the top quarter averaged the 86th. Yet they rated their own standing almost alike: at the 62nd and 68th percentiles respectively [2]. Actual performance differed by 74 percentile points; self-assessments by just six. A rating of where you stand among others is not the same as confidence in a particular claim, and group averages cannot tell us everything about individuals. Even so, the figures show why we cannot work backwards from a high self-rating to a verdict of low competence.
A degree does not settle whether a particular claim is true, either. It gives us reason to expect a level of training, sometimes a very high one. It does not relieve us of checking the claim.
Think back to the student and the square root. The rule is correct for real numbers. The mistake begins when the student treats it as a law of all mathematics. Someone with far more impressive qualifications can make a similar mistake by forgetting the limits of a familiar model.
I want to know what a person is claiming and what supports it. Which parts are observations? Which are assumptions? Under what conditions does the conclusion stop working? We can test those questions without trying to read the answer from the speaker’s biography.
Back in the Hacker News discussion, the commenter never explained what was wrong with the biotechnology proposal. They just named a psychological effect.
Whether the proposal itself was sound is impossible to tell from that reply.
All we learned was that its author had been offered a place in the dictionary, next to two psychologists.
References
- Hacker News. Discussion invoking the Dunning–Kruger label against another participant, August 2026. Discussion.
- Kruger J, Dunning D. (1999). Unskilled and unaware of it: How difficulties in recognizing one’s own incompetence lead to inflated self-assessments. Journal of Personality and Social Psychology, 77(6), 1121–1134. DOI.
- Krueger J, Mueller RA. (2002). Unskilled, unaware, or both? The better-than-average heuristic and statistical regression predict errors in estimates of own performance. Journal of Personality and Social Psychology, 82(2), 180–188. PubMed.
- Nuhfer E et al. (2016). Random Number Simulations Reveal How Random Noise Affects the Measurements and Graphical Portrayals of Self-Assessed Competency. Numeracy, 9(1). DOI.
- Gignac GE, Zajenkowski M. (2020). The Dunning-Kruger effect is (mostly) a statistical artefact: Valid approaches to testing the hypothesis with individual differences data. Intelligence, 80, 101449. DOI.
- Fix B. (2022). The Dunning-Kruger Effect is Autocorrelation. Economics from the Top Down.
- Andersource. (2022). I can’t let go of “The Dunning-Kruger Effect is Autocorrelation”. Andersource.
- Jansen RA, Rafferty AN, Griffiths TL. (2021). A rational model of the Dunning–Kruger effect supports insensitivity to evidence in low performers. Nature Human Behaviour, 5, 756–763. DOI.
- McIntosh RD et al. (2022). Skill and self-knowledge: Empirical refutation of the dual-burden account of the Dunning–Kruger effect. Royal Society Open Science, 9, 191727. DOI.
- The Null Institute. (2026). Dunning–Kruger Reanalysis: The Scale, the Baseline, and the Error Curve. Research note.
- Moore DA, Healy PJ. (2008). The Trouble with Overconfidence. Psychological Review, 115(2), 502–517. DOI.
- JCVI. (7 April 2021). Statement on use of the AstraZeneca COVID-19 vaccine. GOV.UK.