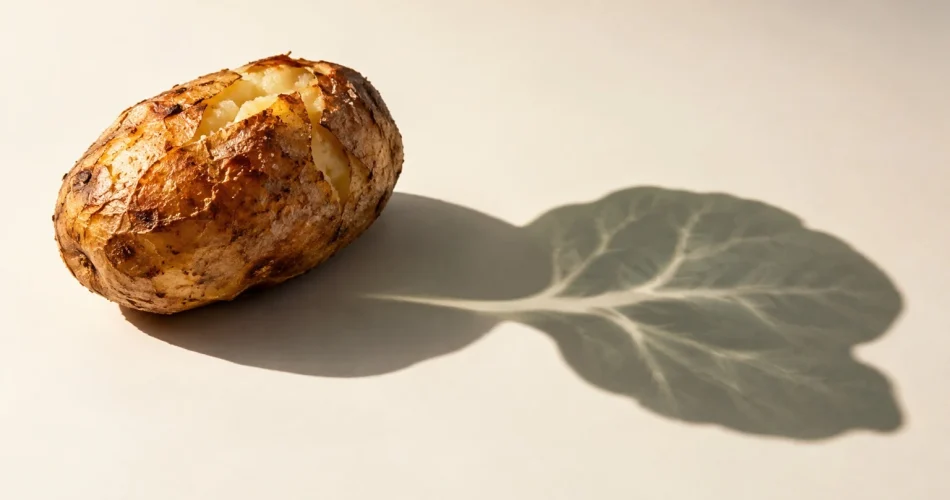
Raw spinach has five times as much cadmium as baked potato by weight. On reported eating-day portions, the potato comes out ahead. We tried a country ranking too, then discarded it when the available comparisons proved too thin.
US government food tests give raw spinach a clear lead: about 228 µg of cadmium per kilogram, against 45 µg/kg in skin-on baked potato. But few people eat a kilogram of either.
In US dietary recalls, the observed eating-day portions were 25 g of spinach and 285 g of potato. Multiply each laboratory average by its corresponding portion and the order reverses: 5.7 µg in spinach, 12.9 µg in potato.
That is only the first trap. Total arsenic can mean different things in salmon and rice; “not detected” may tell you as much about the instrument as the food. Our attempt to compare countries ended when directly matched foods covered only about 11% of recorded intake mass in a Dutch adult-survey subset and 12% in Denmark’s.
Explore the Food Market Atlas · compare 165 foods by portion
One potato, two answers
To calculate the difference, we combined FDA measurements from 2018–2022 with adult eating-day portions in NHANES. The reported portion medians came from different groups of people, not one person’s daily routine.
Preparation matters: this is raw spinach versus skin-on baked potato. Cooking and moisture loss can change both concentration and weight. For mass concentrations, 1 µg/kg equals one part per billion (ppb).
The lab concentration points to spinach. The reported eating-day portion points to potato.
ABOUT A HANDFUL
ABOUT ONE LARGE POTATO
We built the Food Market Atlas by joining FDA and European monitoring with observed US eating-day portions. It contains 943 food entries and 9,248 derived food–analyte profiles. The Explorer compares 165 foods with matched portions; the rest are available as downloadable data. We carried out no new laboratory tests.
See the original eight-food calculations (per kg vs per serving)
| Food | Observed median portion among US adults who ate it | Mean cadmium (µg/kg) | Estimated cadmium in that portion (µg) |
|---|---|---|---|
| Baked potato, skin on | 285 g | 45 | 13 |
| Fast-food French fries | 110 g | 60 | 6.6 |
| Raw spinach | 25 g | 230 | 5.7 |
| Boiled broccoli | 155 g (≈1 US cup) | 17 | 2.7 |
| Wholemeal sliced bread | 66 g | 30 | 2 |
| Cooked brown rice | 147 g | 8.4 | 1.2 |
| Cooked white rice | 158 g (≈1 US cup) | 7.7 | 1.2 |
| Strawberries | 72 g | 10 | 0.73 |
Source: FDA Total Diet Study 2018–2022 (the number of FDA laboratory results varies by food and analyte: 1–44 across this dataset) × NHANES dietary recalls 2021–2023 (weighted eating-day median portions among consumers; spinach n = 106, potato n = 34). Values rounded to two significant figures.
Cadmium per serving: the top 20 in our data
The baked potato tops our comparison of 165 foods with matched US data. The surprise in second place: just 23 g of roasted sunflower seeds, with about 8.08 µg of modelled cadmium. But the estimate rests on only five FDA laboratory results and a portion median from 11 NHANES consumers, so the exact position is uncertain. Raw spinach ranks fourth, despite having about five times the cadmium concentration of potato.
| # | Food as tested | Portion | Cadmium | FDA n | NHANES n |
|---|---|---|---|---|---|
| 1 | Potato, with peel, baked | 285 g | 12.88 µg | 44 | 34 |
| 2 | Seeds, sunflower, shelled, salted, roasted | 23 g | 8.08 µg | 5 | 11 |
| 3 | Potatoes, French fries, fast-food | 110 g | 6.56 µg | 44 | 289 |
| 4 | Spinach, raw | 25 g | 5.71 µg | 44 | 106 |
| 5 | Collards, raw/frozen, boiled | 113.75 g | 3.61 µg | 44 | 9 |
Show the other 15 foods (ranks 6–20)
| # | Food as tested | Portion | Cadmium | FDA n | NHANES n |
|---|---|---|---|---|---|
| 6 | Soup, tomato, canned, condensed, prepared with water | 367.5 g | 3.43 µg | 5 | 26 |
| 7 | Chips, potato | 28 g | 3.37 µg | 5 | 264 |
| 8 | Juice, tomato-vegetable | 248 g | 2.97 µg | 5 | 39 |
| 9 | Tuna, canned in water, drained solids | 113.4 g | 2.82 µg | 5 | 55 |
| 10 | Veggie burger | 160 g | 2.70 µg | 5 | 31 |
| 11 | Chili con carne with beans, canned | 453.6 g | 2.69 µg | 5 | 28 |
| 12 | Soup, ramen noodles, prepared with water | 440 g | 2.68 µg | 5 | 64 |
| 13 | Broccoli, raw/frozen, boiled | 155 g | 2.66 µg | 44 | 70 |
| 14 | Quinoa, cooked | 170 g | 2.55 µg | 5 | 12 |
| 15 | Cereal, bran with raisins | 60 g | 2.44 µg | 5 | 94 |
| 16 | Cocoa powder | 5 g | 2.11 µg | 3 | 9 |
| 17 | Bread, whole wheat, pre-sliced | 66 g | 1.99 µg | 44 | 155 |
| 18 | Asparagus, raw/frozen, boiled | 112 g | 1.92* µg | 44 | 26 |
| 19 | Peanuts, dry roasted, salted | 42.53 g | 1.89 µg | 5 | 132 |
| 20 | Cookies, chocolate chip | 40 g | 1.82 µg | 5 | 256 |
Reading the numbers: Cadmium is in µg per modelled serving; FDA n is the number of laboratory results and NHANES n is the number of people behind the eating-day portion estimate. These are unequal sample sizes, not a statistically tested league table. * means the upper estimate includes non-detect substitutions.
Method: FDA Total Diet Study 2018–2022 mean concentration × NHANES adult eating-day median portion (g) / 1,000, ranked by upper modelled amounts. Only US measurements are used here.
Why not Top 20 for lead or inorganic arsenic? For lead, 157 of 165 matched food records have non-detect substitution ranges, so a numerical rank can be unstable. For inorganic arsenic, only three matched foods have measurements. Twenty ranked entries would create an illusion of knowledge.
Three things you can actually do
- Cook rice differently when it is a staple. The FDA reports that boiling in 6–10 parts water to one part rice and draining can reduce inorganic arsenic by about 40–60%. It also washes away some added iron and B vitamins from enriched rice.
- Choose fish by species. Follow FDA/EPA advice, especially for children and pregnancy. Avoiding all fish is not what these measurements support.
- Vary your everyday staples. Potatoes, grains, bread and vegetables can matter to cumulative intake because portions and frequency add up. Swapping any one food is not guaranteed to lower exposure, so keep the overall diet varied.
Why the ranking flips
Choose two foods and see how laboratory concentrations translate into observed eating-day portions. The comparison includes 165 foods with usable portion data. The other 778 lab-tested entries remain in the downloadable research dataset, but cannot support this serving comparison.
Only foods with an observed adult portion are listed here. For example, BF means baby food; those laboratory tests have no matched adult portion and remain in the full downloadable data.
Blue = first food. Purple = second. Compare the amounts for each substance below.
How to read the comparison
Grey bars mean modelled ratios stay within an editorial 1.5× threshold; they do not mean identical amounts. For uncertain comparisons, both numeric ranges are displayed. A single measured food is shown without a ranking. Each substance has its own scale.
How does the 1.5× comparison work?
Our 1.5× threshold is editorial, not a statistical significance test. A modelled amount is labelled larger only if its lower non-detect substitution estimate is at least 1.5× the other food’s upper estimate. Values are within the threshold only if every bound-compatible ratio is below 1.5×. Otherwise both ranges are shown without ranking. Variation among samples, cooking, and usual frequency are not included.
Other elements, nutrients and chemical forms
Primary measurements, samples, pesticides and radionuclides
The two source lists scroll independently. These are reported laboratory results, not unique shopping items.Select a food to inspect its laboratory records.
Food A
Food B
For observed portions: 12.9 µg cadmium in baked potato versus 5.7 µg in raw spinach. Spinach has the higher concentration per kilogram. This is not a nutritional ranking.
About 47.5 µg total arsenic in 140 g baked salmon versus 8.0 µg in 158 g cooked white rice. Total arsenic is not an inorganic-arsenic risk comparison.
About 10.3 µg total arsenic in a 147 g brown-rice serving versus 8.0 µg in 158 g white rice. Different nutrients and arsenic species are not captured by this comparison.
Sources: FDA TDS 2018–2022; BfR MEAL; EFSA monitoring (DK/NL); NHANES 2021–2023 portion medians. Additional FDA elements, pesticide detections and radionuclide activity appear in disclosures. These are historical monitoring estimates and illustrative portion scenarios, not a regulatory compliance checker or personal medical assessment.
Search 165 foods with observed eating-day portions. The downloadable dataset contains another 778 foods without matched portion estimates. Results from different monitoring markets are kept separate, and “not detected” does not mean zero.
The problem with the word “arsenic”
Next comes the chemical name. With arsenic, the label can matter more than the number.
Our calculations put total arsenic at roughly 47.5 micrograms in a 140-gram serving of baked salmon (about 5 oz), compared with 8.0 micrograms in a 158-gram serving of cooked white rice and 10.3 micrograms in a 147-gram serving of brown rice.
Seafood and rice do not contain arsenic in the same chemical forms. Inorganic arsenic, measured in selected rice samples, is a greater toxicological concern than many common organic forms in fish. Our white-rice samples imply about 8.3 µg in a modelled 158 g portion, but there were only six selected inorganic-arsenic composites.
How the arsenic and mercury measurements work · sources, samples and EFSA reference points
Arsenic in seafood often includes arsenobetaine, but marine fish can also contain arsenolipids and other organoarsenic compounds, whose toxicology differs and is not always fully characterised. Rice can contain inorganic arsenic, alongside other forms. Total arsenic is not a toxic-equivalence measure. Our atlas has no matching inorganic-arsenic measurement for baked salmon, so the two foods cannot be ranked for that specific exposure.
But the FDA atlas does have selected inorganic-arsenic measurements for rice. Six analysed white-rice composites average about 52 µg/kg inorganic arsenic, or 8.3 µg for a modelled 158 g portion. Separately, 44 composites average about 50 µg/kg total arsenic, or 8.0 µg per portion. These were different, selectively analysed groups, so the slightly higher inorganic mean does not violate chemistry: they are not paired results and must not be subtracted. FDA specifically conducts arsenic speciation in selected rice-containing foods. Six composites are informative, not a representative national exposure estimate.
THE ARSENIC NUMBER THAT NEEDS A WARNING LABEL
In its 2024 assessment, EFSA used a BMDL05 reference point of 0.06 µg/kg body weight per day for inorganic arsenic, equivalent to 4.2 µg/day at 70 kg. Our six selected rice analyses imply about 8.3 µg for a modelled 158 g serving. That arithmetic is striking, but it does not establish that an ordinary serving of white rice exceeds a safe limit: a BMDL is not a safe-intake limit, and these six samples are not a representative random sample of rice.
FDA selectively tests certain foods for arsenic species when total arsenic exceeds a specified concentration. That selection can bias the observed subset upwards. Without the exact sample-level matching and a representative speciation dataset, this atlas cannot derive a typical consumer's margin of exposure (MOE) from those six results. EFSA did not set a single MOE threshold that defines low concern for this cancer-based reference point.
One useful action does not require a personalised risk score: the FDA advises that cooking rice in plenty of water, about 6–10 parts water to one part rice, then draining the excess, can reduce inorganic arsenic by roughly 40–60% depending on the rice. The trade-off is real: this also removes roughly 50–70% of some added iron and B vitamins from enriched rice. Simply rinsing rice before cooking has much less effect on arsenic. A varied selection of grains remains sensible, especially for children.
Nor should the salmon example be confused with mercury. In the same FDA dataset, baked salmon averaged about 20 micrograms of total mercury per kilogram, equivalent to 2.8 micrograms in a 140-gram portion. Mercury exposure from fish depends strongly on species and, particularly, methylmercury content. The FDA and EPA offer species-specific fish advice, including special recommendations for pregnancy and childhood. Salmon is among their lower-mercury choices.
Sometimes “zero” means “we couldn't measure it”
Across 5,225 FDA results for each of the substances in our 2018–2022 analysis, approximately 86% of lead measurements and 92% of mercury measurements were reported below their respective laboratory thresholds. That is very different from demonstrating that those foods contained none of either element.
A result below the threshold may reflect a tiny concentration, a genuinely absent substance, or simply a measurement method unable to distinguish the two. Assigning every such result a zero can make one product appear remarkably clean. Assigning every result the laboratory limit can overstate its estimated average.
The chromium results in baked potato show the problem: only 2 of 44 laboratory composites had detected amounts. Depending on how the non-detects are treated, the estimated 285 g portion ranges from 0.80 to 14 µg. Those figures describe the uncertainty of the calculation, not the range of individual potatoes.
Why laboratory results disagree · detection limits, composites and sample variation
Consider chromium in a baked potato with its skin. Across 44 FDA composite results, alternative treatments of non-detects yield a mean of 2.8–51 µg/kg, an eighteen-fold span. Only 2 of 44 composite results had detectable chromium. At the 285 g portion, the corresponding modelled estimates are 0.80–14 µg. The difference reflects the handling of results below the reporting threshold, not the observed range of individual potatoes.
These are lower- and upper-bound substitutions, not confidence intervals or the range between individual potatoes on sale. More sensitive tests could narrow the gap.
That is why the Explorer sometimes refuses to rank two foods. The uncertainty is in the measurement, not a malfunction of the calculator.
How much do results vary between samples?
An average also hides dispersion. Among the 44 FDA composite results, the middle 80% of cadmium concentrations extended from approximately 100 to 368 micrograms per kilogram for raw spinach, and 25 to 64 for baked potato with skin.
But the word composite matters. For regional foods, the FDA may combine purchases from three cities into one prepared laboratory sample. Germany's MEAL Study also analyses pooled foods. Such methods are valuable for estimating what a diet contains on average. They can also smooth away the extremes of individual items.
So the ranges above describe the tested composites. They are not odds for the next bag of spinach or potato you buy. And a confidence interval around a laboratory average, even when available, would answer a different question from the spread between products on sale.
Why the country ranking failed
We almost published a different chart: which country has the most cadmium in its food? The ingredients looked promising. The German BfR MEAL Study measured 356 prepared foods; there were monitoring records from Denmark and the Netherlands, plus roughly 455,000 EFSA food-consumption summary rows to investigate.
Then we asked the question that mattered: how much of the reported diet could we directly match to contaminant measurements? For cadmium, the matched foods accounted for only about 11% of reported intake mass in a Dutch adult-survey subset and 12% in Denmark. The remaining 88–89% was unmatched intake mass, not a measurement of uncontaminated food.
That was the end of our country ranking. Differences in food definitions, years and sampling designs made the surviving fragments still less comparable: some were retail composites, others targeted controls or supply-chain goods. Rather than fill the gaps with assumptions, we kept each monitoring market separate in the Explorer.
What if you eat that potato every day?
Cadmium can accumulate in the body over years, particularly in the kidneys. So a single dinner is not the right time scale for assessing long-term exposure.
Cadmium illustrates why that last distinction matters. EFSA established a tolerable weekly intake of 2.5 micrograms per kilogram of body weight. For a 70-kilogram adult, that is 175 micrograms across an entire week from the whole diet. One modelled 285 g baked-potato portion contains approximately 12.9 µg. If that portion were eaten every day, the potato alone would contribute about 90 µg per week, or 52% of the weekly benchmark, before counting any other food. That is an illustrative daily-repeat scenario, not measured habitual intake. The Explorer itself compares modelled amounts in individual servings, not complete meals or weekly exposure.
Exposure benchmarks and special cases · nickel, lead and dietary risk
Don’t throw out a nutritious food because a contaminant number looks large. First check whether the figure describes a kilogram, a portion or repeated exposure, and which chemical was measured.
One important exception concerns people who are sensitised to nickel. EFSA’s 2020 nickel assessment uses a chronic tolerable daily intake of 13 µg/kg body weight, but also identifies acute flare-ups of systemic contact dermatitis after oral nickel exposure. The Explorer reports quantities, not a prediction of acute reactions in sensitised people.
What does help is to make decisions at the right level of specificity. Follow fish guidance by species, rather than avoiding seafood. If rice is a staple, consider a variety of grains, especially when feeding young children. And when you read a contamination headline, check whether it reports a concentration per kilogram, the amount in a realistic serving or an estimate of repeated exposure over time.
For lead, a percentage of a safe weekly limit would be misleading because no safe level has been identified. The FDA nevertheless uses interim reference levels of 2.2 µg/day for children and 8.8 µg/day for women of childbearing age. They are exposure-management benchmarks, not assurances of harmlessness or a general adult safe-intake limit. For arsenic, chemical form matters. For mercury, fish species and life stage matter. A universal safety score would hide these distinctions.
The question worth keeping
Our findings began with a potato and a handful of spinach. They led to arsenic compounds, invisible measurements below laboratory limits and a country ranking we could not justify. The difficult part was not finding numbers; it was deciding what they could legitimately mean.
The atlas can show where measured amounts differ. It is just as useful when it cannot. Before deciding that a food is better or worse, ask: what was measured, in which chemical form, and in how much food?
Research methods, sources, limits and data downloads
Mike's Balance harmonised public laboratory and consumption data for Food Market Atlas v1.0. The US core uses the FDA Total Diet Study (2018–2022 fiscal years); observed US portions come from NHANES. European measurements include the BfR MEAL Study, Danish national monitoring and Dutch national monitoring; European food consumption was checked against the EFSA Comprehensive Database. The core atlas contains 3,990 market–food–contaminant profiles; the expanded explorer includes 9,248 derived food–analyte profiles. These are not 9,248 independent laboratory samples or distinct hazards. Processing notes identify recalculations, source mapping and unresolved verification steps, not official laboratory QA failures.
Serving estimates multiply mean laboratory concentrations by observed median portions among people who ate that food on the recall day. They are not average daily exposure in the population, habitual consumption, a prediction for a particular purchase or a dietary-risk assessment. For left-censored laboratory values, the lower calculation substitutes zero and the upper substitutes the reporting limit; neither asserts that the true level is zero or equals the limit. The displayed percentiles describe pooled or composite samples where applicable. Missing measurements do not imply zero contamination.
The full Food Market Atlas dataset (JSON: 943 foods and 9,248 derived profiles) is publicly accessible, with reuse terms and citation guidance. The Explorer also offers a flattened derived-data export, a variable dictionary and the current display/calculation JavaScript. These allow inspection of the displayed quantities and formulas, but do not include individual source laboratory rows or the upstream cleaning and food-matching code. Full independent reproduction of that transformation remains outstanding.
The author’s background is in measurement and quantitative analysis, which informs the treatment of detection thresholds, grouping and uncertainty. This is not a substitute for formal toxicology expertise. Independent toxicology peer review has not yet been completed.
Behind the Atlas: the research that did not fit into this article
Getting from the supermarket shelf to that potato-and-spinach comparison was less tidy than the finished story suggests. We investigated several food-monitoring systems and diet surveys, including questions the evidence would not let us answer.
US data. We recalculated summaries from roughly 110,000 FDA measurements covering 308 foods.
Germany. The BfR MEAL Study analysed 356 prepared foods. Its core results used 869 pooled composite samples assembled from 13,552 individual subsamples. We reconstructed 1,424 food–metal summaries. Pooling is informative, but one composite is not an individual product on a shop shelf.
European monitoring. We added Danish and Dutch occurrence records, preserving their sampling market and source descriptions. Some represent targeted inspections or supply-chain goods rather than a representative supermarket basket. Data from four markets cannot legitimately be used to rank the four countries by food safety.
The calculation we refused to publish. We examined around 455,000 EFSA food-consumption summary rows across 28 countries, including eight adult-survey subsets for Denmark, the Netherlands and Finland. A stricter food matching exercise yielded 659 candidate food–analyte links. For cadmium, directly matched products covered only about 12% of intake mass in Denmark and 11% in the Netherlands. That is nowhere near enough to estimate full national exposure. Rather than invent the missing dose, we dropped the country ranking.
Other branches. NHANES provided eating-day portions, not how often a person eats a given food. We also explored pesticide detections and radionuclide activity: a pesticide-detection percentage is not a toxicity score, while activity in becquerels cannot be ranked alongside metal mass in micrograms.
What readers can inspect. The searchable atlas contains 943 food entries and 9,248 derived food–analyte profiles. Downloadable aggregates, a variable dictionary and calculator code are included. The original laboratory records, full cleaning pipeline and independently verified mapping for every source are not. Some mappings remain provisional, and there has been no external toxicology peer review.
Additional context: EFSA on inorganic arsenic, EFSA on cadmium, FDA on lead and IRLs, and FDA/EPA advice on eating fish.